Become a Premium member for
only $180 (AUD).
Subscribe by 31 May 2003.
The Daily Trading Diary will only be available to Premium members.
We have extended the cut-off until mid-May - to fit in with the introduction of US charts.
Subscribe by 31 May 2003.
The Daily Trading Diary will only be available to Premium members.
We have extended the cut-off until mid-May - to fit in with the introduction of US charts.
Trading Diary
May 15, 2003
These extracts from my daily trading diary are
intended to illustrate the techniques used in short-term trading
and should not be interpreted as investment advice. Full terms
and conditions can be found at Terms
of Use .
USA
The Dow forms a small
pennant continuation pattern, rallying 0.7% to close at 8713
on higher volume.
The intermediate trend is up.
The primary trend is down; a rise above 9076 will signal a reversal.
The intermediate trend is up.
The primary trend is down; a rise above 9076 will signal a reversal.
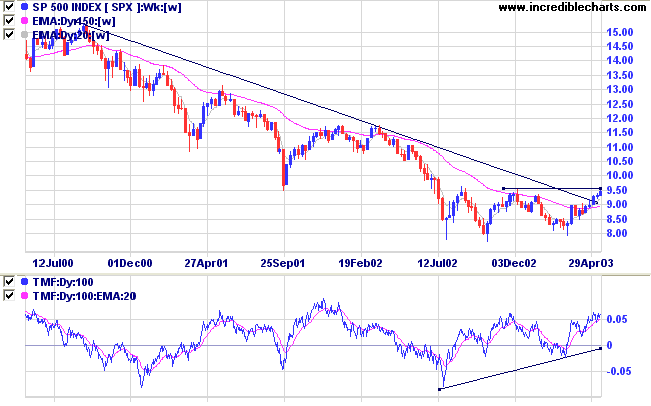
The S&P 500 gained 7 points to close at
946.
The intermediate up-trend continues.
The primary trend is down; a rise above 954 will signal an up-trend.
The intermediate up-trend continues.
The primary trend is down; a rise above 954 will signal an up-trend.
The Nasdaq Composite rallied more than 1% to
close at 1551.
The intermediate trend is up.
The index is in a primary up-trend.
The Chartcraft NYSE Bullish % Indicator increased to 59.95% on May 14, following a Bull Correction buy signal on April 3.
The intermediate trend is up.
The index is in a primary up-trend.
The Chartcraft NYSE Bullish % Indicator increased to 59.95% on May 14, following a Bull Correction buy signal on April 3.
Market Strategy
Short-term: Long if the S&P 500 is above
948; short if the S&P intermediate trend reverses down (or
falls below 898).
Intermediate: Long only when the Dow/S&P
primary trend turns upwards; short if the intermediate trend
(S&P) reverses down.
Long-term: There are already two bull signals: the March 17 follow through day and the April 3 NYSE Bullish % signal. Wait for confirmation from a Dow/S&P primary trend reversal.
Long-term: There are already two bull signals: the March 17 follow through day and the April 3 NYSE Bullish % signal. Wait for confirmation from a Dow/S&P primary trend reversal.
Gold
New York (18.08): Spot gold has retreated to $US 351.40.
On the five-year chart gold has respected the long-term upward trendline.
New York (18.08): Spot gold has retreated to $US 351.40.
On the five-year chart gold has respected the long-term upward trendline.
ASX Australia
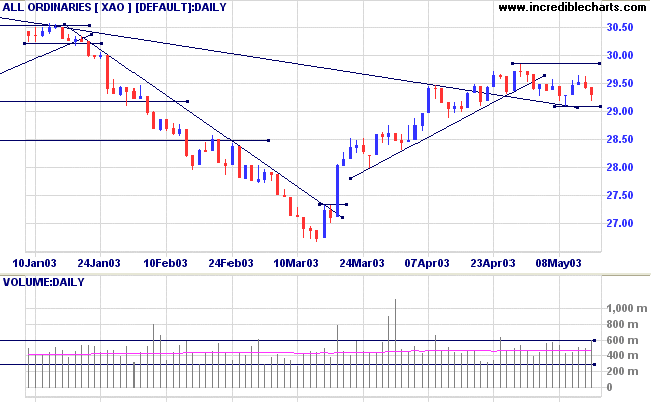
The All Ordinaries lost 12 points to close at 2931. The long
shadow, strong volume and positive performance of the US market
are bullish factors; the index may still hold above the 2909
support level.
The intermediate trend is up; a close below 2909 will signal a reversal.
The primary trend is down. A rise above 3062 will signal an up-trend.
MACD (26,12,9) is below its signal line; Slow Stochastic (20,3,3) has crossed back below; Twiggs Money Flow (21) is weakening.
The intermediate trend is up; a close below 2909 will signal a reversal.
The primary trend is down. A rise above 3062 will signal an up-trend.
MACD (26,12,9) is below its signal line; Slow Stochastic (20,3,3) has crossed back below; Twiggs Money Flow (21) is weakening.
Market Strategy
Short-term: Long if the All Ords rises above 2943; short if the
XAO falls below 2909.
Intermediate: Long if the primary trend reverses up (XAO above 3062); short if the intermediate trend reverses down (falls below 2909).
Long-term: There is already a bull signal: the March 18 follow through. Wait for confirmation from a primary trend reversal.
Intermediate: Long if the primary trend reverses up (XAO above 3062); short if the intermediate trend reverses down (falls below 2909).
Long-term: There is already a bull signal: the March 18 follow through. Wait for confirmation from a primary trend reversal.
Tabcorp Holdings [TAH]
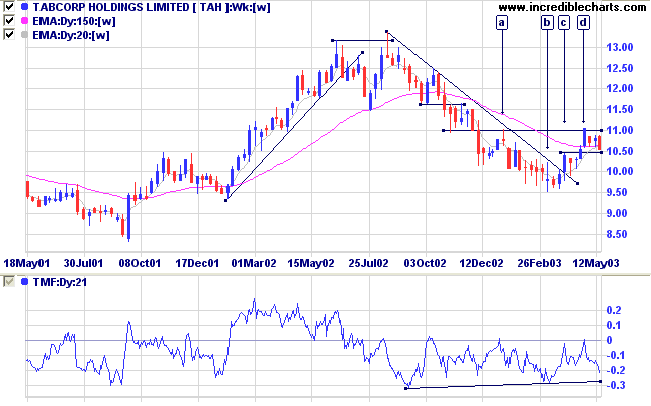
Last covered on April 23, 2003.
After rallying to test resistance at 11.00 [d], TAH has retreated to below the long-term moving average.
Twiggs Money Flow (21-day) has failed to cross above zero and signals strong distribution.
Relative Strength (price ratio: xao) and MACD have turned downwards.
Last covered on April 23, 2003.
After rallying to test resistance at 11.00 [d], TAH has retreated to below the long-term moving average.
Twiggs Money Flow (21-day) has failed to cross above zero and signals strong distribution.
Relative Strength (price ratio: xao) and MACD have turned downwards.
The equivolume chart shows that TAH penetrated resistance at [d]
but then gapped back below at [1] on strong volume.
This was followed by a period of consolidation on lower volume and some short-term traders may have entered on a rise above the high of [2]. The rally to [3] was on thin volume and price then retreated below support at [4]; knocking out stops placed below the low of [2].
This was followed by a period of consolidation on lower volume and some short-term traders may have entered on a rise above the high of [2]. The rally to [3] was on thin volume and price then retreated below support at [4]; knocking out stops placed below the low of [2].
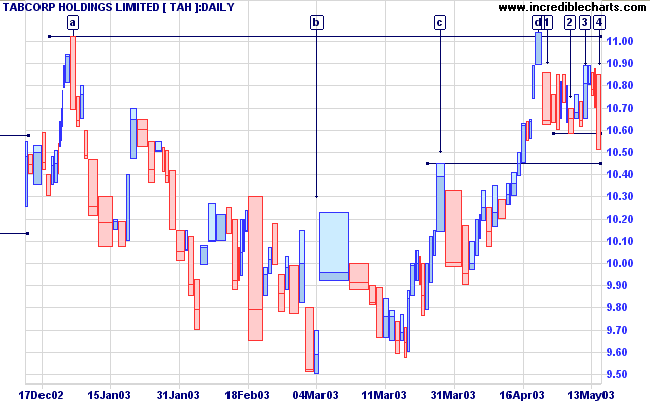
A break below 10.45, the high of [c], would be a strong bear
signal.
Consolidation above 10.45 would be a bullish sign and may signal that another attempt at 11.00 resistance is likely.
Consolidation above 10.45 would be a bullish sign and may signal that another attempt at 11.00 resistance is likely.
New! Understanding
the Trading Diary has been expanded to offer further
assistance to readers.
Colin Twiggs
One should count each day a separate
life.
- Seneca (4BC to 65AD).
Back Issues
Click here to access the Trading Diary Archives.
Click here to access the Trading Diary Archives.
Back Issues
Access the Trading Diary Archives.