Become a Premium member for
only $180 (AUD).
Subscribe by 31 May 2003.
The Daily Trading Diary will only be available to Premium members.
We have extended the cut-off until mid-May - to fit in with the introduction of US charts.
Subscribe by 31 May 2003.
The Daily Trading Diary will only be available to Premium members.
We have extended the cut-off until mid-May - to fit in with the introduction of US charts.
Trading Diary
May 6, 2003
These extracts from my daily trading diary are
intended to illustrate the techniques used in short-term trading
and should not be interpreted as investment advice. Full terms
and conditions can be found at Terms
of Use .
USA
The Dow is slowly wedging upwards with
decreasing volume on the up-swings, rather than making a clear
break above resistance; a bearish sign. The index gained 0.6% to
close at 8588 on slightly higher volume.
The intermediate trend is down. I prefer to wait for a clear break above resistance (8643) to signal the start of an up-trend. A fall below 8258 will signal continuation.
The primary trend is down; a rise above 9076 will signal a reversal.
The S&P 500 rallied 8 points to close at 934.
The slow intermediate up-trend continues, approaching resistance at 940.
The primary trend is down; a rise above 954 will signal a reversal.
The Nasdaq Composite broke above resistance to set a new 6-month high of 1523; up 1.3% on the day.
The intermediate trend is up.
The primary trend is up.
The Chartcraft NYSE Bullish % Indicator is at 55.25% (May 5), following a Bull Correction buy signal on April 3.
Market Strategy
Short-term: Avoid long - the S&P 500 (and
Dow) are close to resistance levels; short if the S&P
intermediate trend reverses down (or falls below 898).
Intermediate: Long only when the Dow/S&P
primary trend reverses upwards; short if the intermediate trend
(S&P) reverses down.
Long-term: There are already two bull signals: the March 17 follow through day and the April 3 NYSE Bullish % signal. Wait for confirmation from a Dow/S&P primary trend reversal.
Long-term: There are already two bull signals: the March 17 follow through day and the April 3 NYSE Bullish % signal. Wait for confirmation from a Dow/S&P primary trend reversal.
Federal Reserve holds rates
The Federal Reserve policy meeting decides to leave the overnight lending rate unchanged at the 40-year low of 1.25%; and warns of downside risks. (more)
The Federal Reserve policy meeting decides to leave the overnight lending rate unchanged at the 40-year low of 1.25%; and warns of downside risks. (more)
Gold
New York (18.30): Spot gold has climbed to $US 344.00.
New York (18.30): Spot gold has climbed to $US 344.00.
ASX Australia
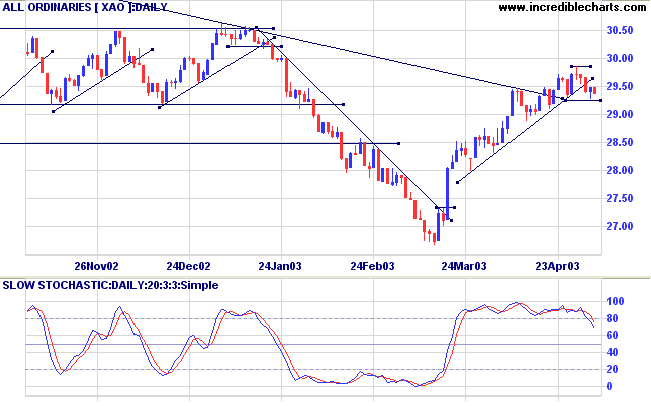
After the bullish hammer
reversal on Monday, the All Ordinaries failed to rally above
the previous day's high of 2949. The index closed down 10 points
at 2938 on higher volume; a bear signal.
The intermediate up-trend continues but the indicators show that it is weakening; a break below Monday's low of 2926 will signal a reversal.
The primary trend is down. A rise above 3062 will signal reversal to an up-trend.
MACD (26,12,9) and Slow Stochastic (20,3,3) are below their signal lines and the Stochastic has fallen below 80%, a further bear signal; Twiggs Money Flow (21) is below its upward trendline but continues to signal accumulation.
Market Strategy
Short-term: Long only if the All Ordinaries index rises above
2950; short if it falls below 2926.
Intermediate: Long if the primary trend reverses up (XAO above
3062); short if the XAO falls below 2926.
Long-term: There is already a bull signal: the March 18 follow through. Wait for confirmation from a primary trend reversal.
Long-term: There is already a bull signal: the March 18 follow through. Wait for confirmation from a primary trend reversal.
QBE Insurance [QBE]
Correction: Yesterday's diary contained a typo - The 21-day Twiggs Money Flow shows a strong bearish divergence.
Correction: Yesterday's diary contained a typo - The 21-day Twiggs Money Flow shows a strong bearish divergence.
Coles Myer [CML]
Last covered on October 18, 2003.
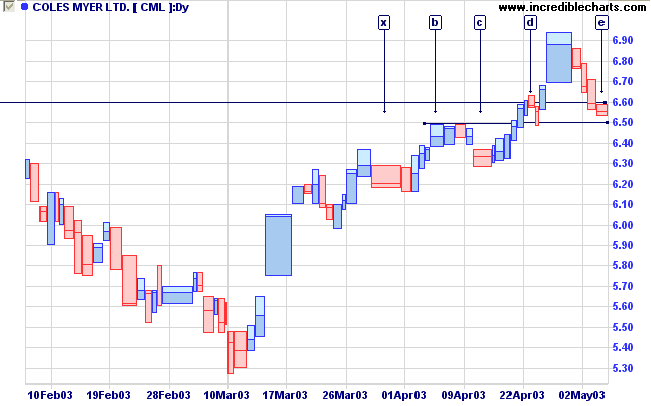
After a sharp downward spike, CML has rallied strongly to a new 6-month high.
Twiggs Money Flow shows a strong bullish divergence at [1], with the trough ending above the zero line.
Last covered on October 18, 2003.
After a sharp downward spike, CML has rallied strongly to a new 6-month high.
Twiggs Money Flow shows a strong bullish divergence at [1], with the trough ending above the zero line.

On the daily chart there is a gap above the downward trendline at
[a]; a strong bull signal.
Later, CML broke above resistance after a short pull-back at [d], but has since corrected to test the new support level at [e].
Relative Strength (price ratio: xao) and MACD are bullish.
Later, CML broke above resistance after a short pull-back at [d], but has since corrected to test the new support level at [e].
Relative Strength (price ratio: xao) and MACD are bullish.

The equivolume chart shows buyers entering the market on
corrections at [x], [c] and [e], resulting in over-square bars.
The stock should find support at the 6.50 level and there may be
an entry opportunity if CML rallies above the high of [e]. Tight
stops can be placed below the low of [e]. More conservative
traders may wait for a dry-up of volume on the next pull-back
before taking long positions.
A break below 6.50 would be a bear signal.
A break below 6.50 would be a bear signal.
New! Understanding
the Trading Diary has been expanded to offer further
assistance to readers.
Colin Twiggs
Everybody is ignorant.
Only on different subjects.
- Will Rogers.
Back Issues
Click here to access the Trading Diary Archives.
Click here to access the Trading Diary Archives.
Back Issues
Access the Trading Diary Archives.