Daylight Saving ends 30 March 2003
As of 3.00am AEST, Sunday 30 March 2003, Daylight Saving ends in New South Wales, Victoria, South Australia, Tasmania and the ACT.
Market hours remain unchanged in these states, but will commence (and end) one hour later in all other states.
As of 3.00am AEST, Sunday 30 March 2003, Daylight Saving ends in New South Wales, Victoria, South Australia, Tasmania and the ACT.
Market hours remain unchanged in these states, but will commence (and end) one hour later in all other states.
Trading Diary
March 31, 2003
These extracts from my daily trading diary are
intended to illustrate the techniques used in short-term trading
and should not be interpreted as investment advice. Full terms
and conditions can be found at Terms
of Use .
USA
The last day of the quarter ended with a sharp fall: the Dow
dropped 1.9% to 7992 on higher volume.
Monday 17th's follow through signal remains valid so long as the index holds above 7763.
The intermediate cycle is down, although the trendline has been broken.
The primary trend is down.
The Nasdaq Composite gapped down 2.1% to 1341.
The intermediate trend is down, despite the large correction.
The primary trend is up.
The S&P 500 fell 15 points to 848.
The intermediate trend is down, but the trendline has been broken.
The primary trend is down.
The Chartcraft NYSE Bullish % Indicator is at 38% (March 28).
The method of calculation appears to have changed slightly.
Manufacturing slow
The Chicago-area Purchasing Managers Index declined to 50.5; below expectations. A reading of less than 50 signals contraction in manufacturing activity. (more)
The Chicago-area Purchasing Managers Index declined to 50.5; below expectations. A reading of less than 50 signals contraction in manufacturing activity. (more)
Gold
New York (18.15): Spot gold jumped more than 500 cents to $US 336.90.
New York (18.15): Spot gold jumped more than 500 cents to $US 336.90.
ASX Australia
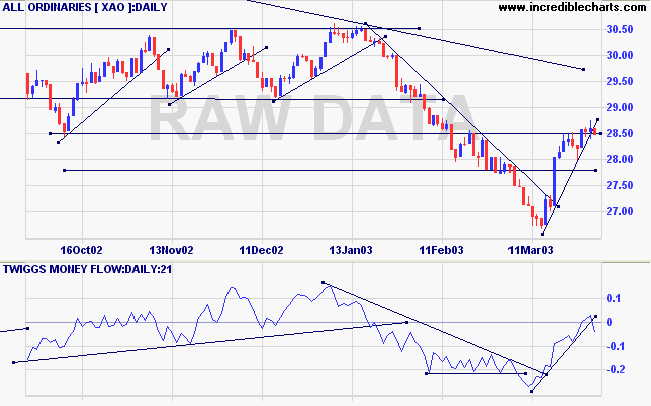
Massive quarter-end volume failed to clear the recent
uncertainty, with the All Ordinaries down 12 points at
2849.
The intermediate up-trend has lost momentum.
The primary trend is down.
MACD (26,12,9) is above its signal line; Slow Stochastic (20,3,3) has crossed to below; Twiggs Money Flow (21) signals distribution.
The intermediate up-trend has lost momentum.
The primary trend is down.
MACD (26,12,9) is above its signal line; Slow Stochastic (20,3,3) has crossed to below; Twiggs Money Flow (21) signals distribution.
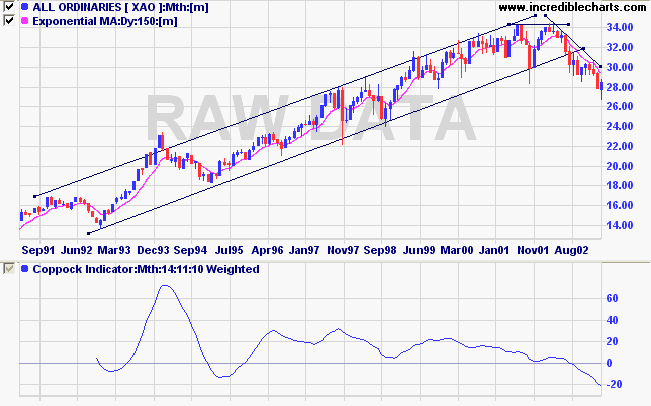
The monthly Coppock Indicator continues to slope downwards. An
up-turn below zero would signal the start of a bull market.
Woolworths [WOW]
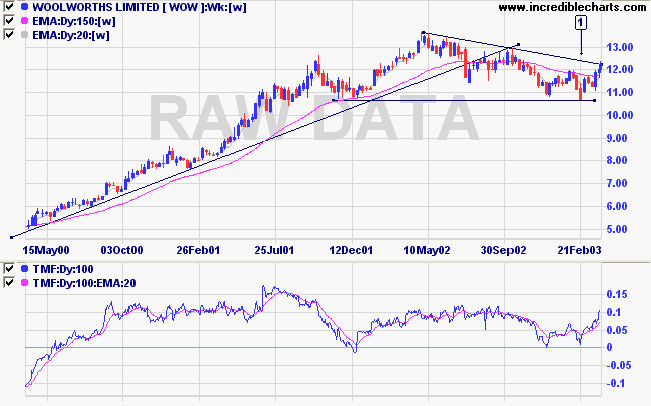
Last covered on December 10, 2002.
The retailer has been in a creeping down-trend since it broke the long-term supporting trendline in 2002. After testing support around 10.70, at [1], the stock has rallied to test the downward trendline.
100-day Twiggs Money Flow shows a bullish divergence at [1].
Relative Strength (price ratio: xao) is rising while MACD and Twiggs Money Flow (21) both display bullish divergences.
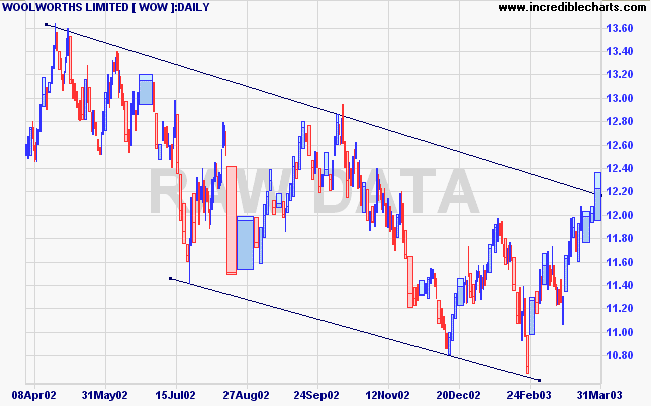
Strong volume on the break above 12.00 is a positive sign but the
weak close on the latest bar signals increased selling
pressure.
A pull-back that respects support at 12.00 will be bullish; a dry-up of volume and volatility on the pull-back would increase the strength of the signal.
A break below the last low, at 11.76, will signal continuation of the down-trend.
A pull-back that respects support at 12.00 will be bullish; a dry-up of volume and volatility on the pull-back would increase the strength of the signal.
A break below the last low, at 11.76, will signal continuation of the down-trend.
Market strategy
For further guidance see Understanding the Trading Diary.
For further guidance see Understanding the Trading Diary.
Short-term: Long if the All Ords breaks above 2875; short if
the break is below 2800.
Medium-term: Avoid new entries.
Long-term: Wait for confirmation of the
bottom reversal signal.
Colin Twiggs
Everything is vague to a degree you do not realize
till you have tried to make it precise.
- Bertrand Russell.
Back Issues
Click here to access the
Trading Diary Archives.
Back Issues
Access the Trading Diary Archives.