Securities menu
We are busy adjusting the menus.
If your Securities menu fails to load, please close the charting application and re-start.
We are busy adjusting the menus.
If your Securities menu fails to load, please close the charting application and re-start.
Trading Diary
March 27, 2003
These extracts from my daily trading diary are
intended to illustrate the techniques used in short-term trading
and should not be interpreted as investment advice. Full terms
and conditions can be found at Terms
of Use .
USA
The Dow weakened slightly, closing at 8201 on lower volume.
Monday 17th's
follow through signal remains valid so long as the index
holds above 7763.
The intermediate cycle is down, although the trendline has been broken.
The primary trend is down.
The Nasdaq Composite gapped down at the open but recovered to close 3 points down at 1384.
The intermediate trend is down, despite the large correction.
The primary trend is up.
The S&P 500 closed 1 point lower at 868.
The intermediate trend is down, but the trendline has been broken.
The primary trend is down.
The Chartcraft NYSE Bullish % Indicator remains at 36% (March 26).
GDP
GDP growth slowed to 1.4% in the fourth-quarter of 2002, after recording 4% in the third-quarter. (more)
Job market remains weak
New unemployment claims remain above 400,000 per week. (more)
GDP growth slowed to 1.4% in the fourth-quarter of 2002, after recording 4% in the third-quarter. (more)
Job market remains weak
New unemployment claims remain above 400,000 per week. (more)
Gold
New York (17.17): Spot gold is down 100 cents at $US 328.70.
New York (17.17): Spot gold is down 100 cents at $US 328.70.
ASX Australia
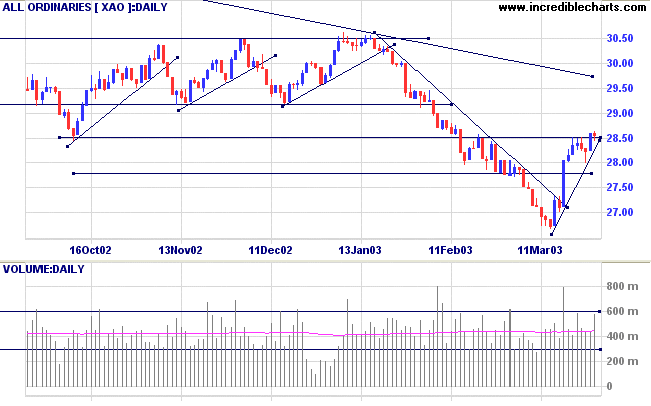
The All Ordinaries closed down 3 points at 2855 on strong volume,
signaling uncertainty.
The intermediate trend is up.
The primary trend is down.
MACD (26,12,9) is above its signal line; Slow Stochastic (20,3,3) is above; Twiggs Money Flow (21) has crossed to above zero, signaling accumulation.
The intermediate trend is up.
The primary trend is down.
MACD (26,12,9) is above its signal line; Slow Stochastic (20,3,3) is above; Twiggs Money Flow (21) has crossed to above zero, signaling accumulation.
Fosters [FGL]
Last covered on July 19, 2002.
FGL is testing resistance at 4.45 and threatens to break above the downward trendline.
100-day Twiggs Money Flow shows a bullish divergence.
Last covered on July 19, 2002.
FGL is testing resistance at 4.45 and threatens to break above the downward trendline.
100-day Twiggs Money Flow shows a bullish divergence.
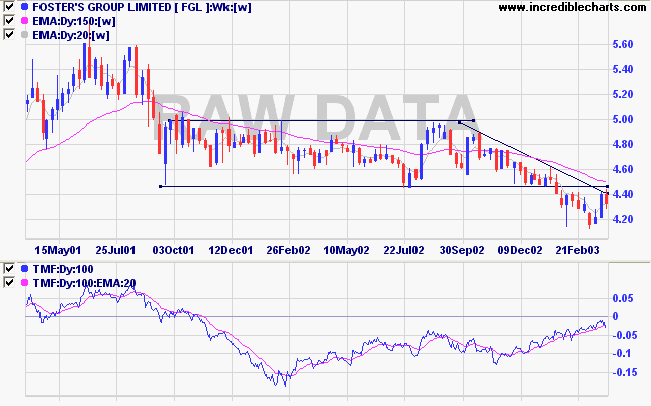
Relative Strength (price ratio: xao) still points down; MACD is
up; 21-day Twiggs Money Flow shows a bullish divergence.
The equivolume chart shows strong volume on the pull-back from 4.45. The long shadow signals buying support. A fall below 4.28 will herald a re-test of support around 4.15. An attempt at the resistance level will be a bullish sign.
The equivolume chart shows strong volume on the pull-back from 4.45. The long shadow signals buying support. A fall below 4.28 will herald a re-test of support around 4.15. An attempt at the resistance level will be a bullish sign.
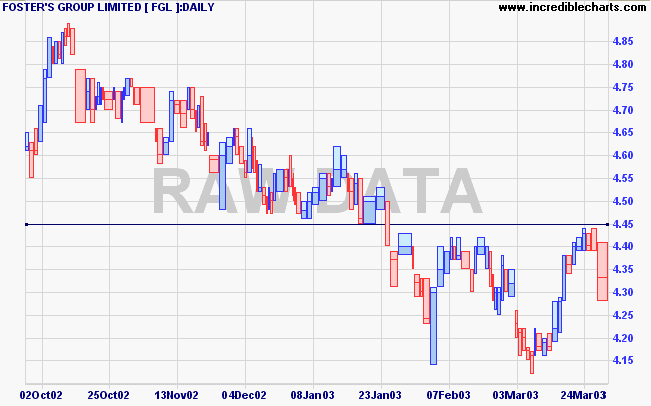
From next week the "Raw Data" watermark will be used to
distinguish raw data from data adjusted for dilutions.
Market strategy
For further guidance see Understanding the Trading Diary.
For further guidance see Understanding the Trading Diary.
Short-term: Long.
Medium-term: Avoid new entries.
Long-term: Wait for confirmation of the
bottom reversal signal.
Colin Twiggs
There is no security on this earth, there is only
opportunity.
- General Douglas MacArthur.
Back Issues
Click here to access the
Trading Diary Archives.
Back Issues
Access the Trading Diary Archives.