Sector
Analysis
Explains how to use the [Sectors ASX 200] project file
and how to set up Sector Comparison charts.
Explains how to use the [Sectors ASX 200] project file
and how to set up Sector Comparison charts.
Trading Diary
March 21, 2003
These extracts from my daily trading diary are
intended to illustrate the techniques used in short-term trading
and should not be interpreted as investment advice. Full terms
and conditions can be found at Terms
of Use .
USA
The Dow rose 2.8% to close at 8521 on sharply higher volume. Two
follow through days in a week are the first strong sign of a
major bottom.
The intermediate cycle is down, although the trendline has been broken.
The primary trend is down.
The Nasdaq Composite gapped up at the opening but failed to make further progress, closing 1.4% up at 1421.
The large correction does not alter the intermediate trend, which is still down.
The primary trend is up.
The S&P 500 jumped 20 points to close at 895.
The intermediate trend is down, but the trendline has been broken.
The primary trend is down.
The Chartcraft NYSE Bullish % Indicator remains at 36% (March 20).
Iraq
Coalition forces commence the predicted "shock and awe" air campaign to break the resolve of Iraqi leadership. Uncertainty continues regarding Saddam Hussein. (more)
Stocks rise as coalition progress in Iraq
Dow component Walt Disney, up 9% on Friday, led blue chips higher. (more)
Back Issues
Coalition forces commence the predicted "shock and awe" air campaign to break the resolve of Iraqi leadership. Uncertainty continues regarding Saddam Hussein. (more)
Stocks rise as coalition progress in Iraq
Dow component Walt Disney, up 9% on Friday, led blue chips higher. (more)
Gold
New York (16.50): Spot gold closed down 690 cents at $US 325.50.
New York (16.50): Spot gold closed down 690 cents at $US 325.50.
ASX Australia
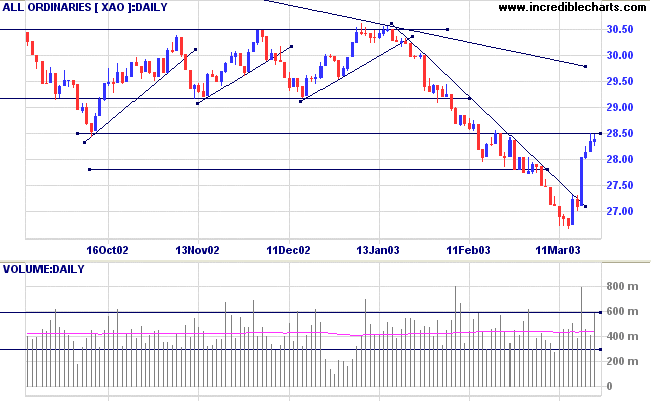
Sellers re-appeared at the 2850 resistance level, with the All
Ordinaries forming a doji while closing at 2839 (3 points
higher) on strong volume.
The intermediate trend is down but the index has broken above the trendline, signaling weakness.
The primary trend is down.
MACD (26,12,9) is above its signal line; Slow Stochastic (20,3,3) is above; Twiggs Money Flow (21) is rising.
The intermediate trend is down but the index has broken above the trendline, signaling weakness.
The primary trend is down.
MACD (26,12,9) is above its signal line; Slow Stochastic (20,3,3) is above; Twiggs Money Flow (21) is rising.
Sector Analysis
Changes are highlighted in bold.
Changes are highlighted in bold.
- Energy [XEJ] - stage 4 (RS is level)
- Materials [XMJ] - stage 2 (RS is rising)
- Industrials [XNJ] - stage 4 (RS is falling)
- Consumer Discretionary [XDJ] - stage 1 (RS is level)
- Consumer Staples [XSJ] - stage 4 (RS is level)
- Health Care [XHJ] - stage 4 (RS is falling)
- Property Trusts [XPJ] - stage 2 (RS is rising)
- Financial excl. Property Trusts [XXJ] - stage 4 (RS is level)
- Information Technology [XIJ] - stage 4 (RS is falling)
- Telecom Services [XTJ] - stage 4 (RS is falling)
- Utilities [XUJ] - stage 2 (RS is rising)
Sector Comparison Chart: Consumer Discretionary has shown the
largest rise in recent weeks.
Sectors: Relative Strength
A stock screen of the ASX 200 using % Price Move (1 month: +5%) returned a sharply higher 24 stocks (compared to 99 on August 23, 2002; and 8 on March 14, 2003). Three industries were represented by more than one stock:
A stock screen of the ASX 200 using % Price Move (1 month: +5%) returned a sharply higher 24 stocks (compared to 99 on August 23, 2002; and 8 on March 14, 2003). Three industries were represented by more than one stock:
- Diversified Metals & Mining (PMM and JBM)
- Food Retail (CML and WOW)
- Pharmaceuticals (SIG and CSL)
Market strategy
For further guidance see Understanding the Trading Diary.
For further guidance see Understanding the Trading Diary.
Short-term: Long if the All Ords rises above 2850. Slow
Stochastic and MACD are above their respective signal lines.
Medium-term: Avoid new entries.
Long-term: Wait for confirmation of the
bottom reversal signal.
Colin Twiggs
A free lunch is only found in mousetraps.
- John Capuzz.
Back Issues
Click here to access the
Trading Diary Archives.
Back Issues
Access the Trading Diary Archives.