Sector
Analysis
Explains how to use the [Sectors ASX 200] project file
and how to set up Sector Comparison charts.
Explains how to use the [Sectors ASX 200] project file
and how to set up Sector Comparison charts.
Trading Diary
March 20, 2003
These extracts from my daily trading diary are
intended to illustrate the techniques used in short-term trading
and should not be interpreted as investment advice. Full terms
and conditions can be found at Terms
of Use .
USA
The Dow made marginal gains to close at 8286 on lower
volume.
The intermediate cycle is down, despite the large correction.
The primary trend is down.
The Nasdaq Composite gapped down at the opening but later rallied to close 5 points up at 1402.
The large correction does not alter the intermediate trend, which is still down.
The primary trend is up.
The S&P 500 closed 1 point up at 875.
The intermediate trend is down.
The primary trend is down.
The Chartcraft NYSE Bullish % Indicator remains at 36% (March 19).
War on Iraq
US forces made an early strike at Baath party leadership. Iraqi forces are reported to have set four oil wells ablaze in southern Iraq, close to the Kuwaiti border. Turkey approves coalition use of Turkish airspace, but also authorizes Turkish troops to enter northern Iraq to create a "buffer zone" - aimed at preventing the Kurds from establishing an independent state in northern Iraq. (more)
Back Issues
US forces made an early strike at Baath party leadership. Iraqi forces are reported to have set four oil wells ablaze in southern Iraq, close to the Kuwaiti border. Turkey approves coalition use of Turkish airspace, but also authorizes Turkish troops to enter northern Iraq to create a "buffer zone" - aimed at preventing the Kurds from establishing an independent state in northern Iraq. (more)
Gold
New York (17.05): Spot gold dipped to $US 331.90.
New York (17.05): Spot gold dipped to $US 331.90.
ASX Australia
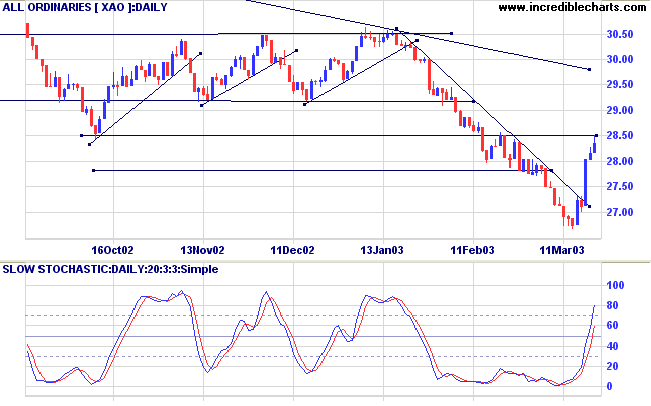
The All Ordinaries closed up 21 points at 2836 on lower
volume.
The intermediate trend is down but the index has broken above the trendline and is testing resistance at 2850.
The primary trend is down.
MACD (26,12,9) is above its signal line; Slow Stochastic (20,3,3) is above; Twiggs Money Flow (21) is rising.
The intermediate trend is down but the index has broken above the trendline and is testing resistance at 2850.
The primary trend is down.
MACD (26,12,9) is above its signal line; Slow Stochastic (20,3,3) is above; Twiggs Money Flow (21) is rising.
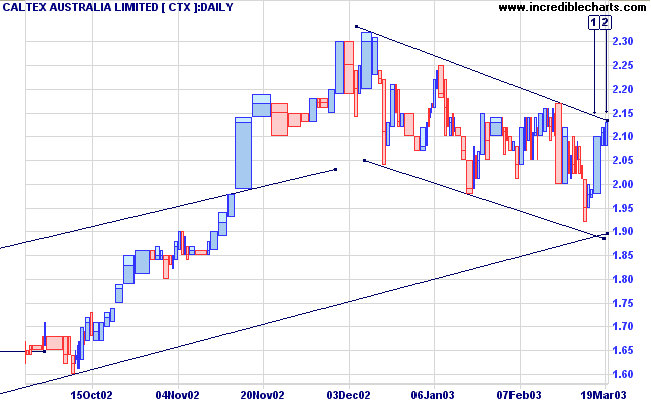
Caltex [CTX]
Last covered on March 17, 2003.
Tuesday, CTX rallied back above 2.00 on strong volume [1].
Volume and trading range dry up on the next two days as price approaches the intermediate trendline at [2]. A decline below 2.08 is likely to signal a re-test of the long-term supporting trendline at 1.90.
Relative Strength (price ratio: xao) is level; Twiggs Money Flow is positive; while MACD is still negative.
A close above the intermediate trendline would be bullish.
Stock Screens: Moving average
crossovers
The screen of MA crossovers (100, 5, bull signal, 9999 days) highlights stocks where the fast MA has not crossed below the longer MA throughout the last 3 months:
The screen of MA crossovers (100, 5, bull signal, 9999 days) highlights stocks where the fast MA has not crossed below the longer MA throughout the last 3 months:
- Unitab
- United Energy
- AGL
- Gunns
- Stockland
- MCG
- Oxiana
- Gasnet
- SIMS
- Hills Motorway
Market strategy
For further guidance see Understanding the Trading Diary.
For further guidance see Understanding the Trading Diary.
Short-term: Long. Slow Stochastic and MACD are above their
respective signal lines.
Medium-term: Avoid new entries.
Long-term: Wait for confirmation of the
bottom reversal signal.
Colin Twiggs
The only man who never makes a mistake
is the man who never does anything.
- Theodore Roosevelt.
Back Issues
Click here to access the
Trading Diary Archives.
Back Issues
Access the Trading Diary Archives.