Market Statistics
The new Premium data will include market statistics:
New Highs/Lows, Advances/Declines and Advance/Decline Volume.
The new Premium data will include market statistics:
New Highs/Lows, Advances/Declines and Advance/Decline Volume.
Trading Diary
March 14, 2003
These extracts from my daily trading diary are
intended to illustrate the techniques used in short-term trading
and should not be interpreted as investment advice. Full terms
and conditions can be found at Terms
of Use .
USA
The surge in the Dow has slowed, with the index up 0.5% at 7859
on lower volume. This is just a counter-trend at this stage,
albeit on strong volume. The intermediate cycle is down; the next
support level is at 7500.
The primary trend is down.
The Nasdaq Composite showed short-term exhaustion after Thursday's gap upwards; closing unchanged at 1340.
The intermediate trend is down, with the next support level at 1200.
The primary trend is up; a fall below 1108 will signal a reversal.
The S&P 500 closed 2 points up at 833. The shooting star reversal requires a close below 818 to complete the pattern.
The intermediate trend is down.
The primary trend is down; the next support level is at 768.
The Chartcraft NYSE Bullish % Indicator is at 36% (March 13).
Wholesale prices rise
The producer price index increased 1% in February, driven by higher oil prices. (more)
The producer price index increased 1% in February, driven by higher oil prices. (more)
Consumer confidence falls
The University of Michigan consumer sentiment index has fallen to 75.0, from 79.9 in February. (more)
The University of Michigan consumer sentiment index has fallen to 75.0, from 79.9 in February. (more)
Gold
New York (16.00): Spot gold closed at $US 336.00.
New York (16.00): Spot gold closed at $US 336.00.
ASX Australia
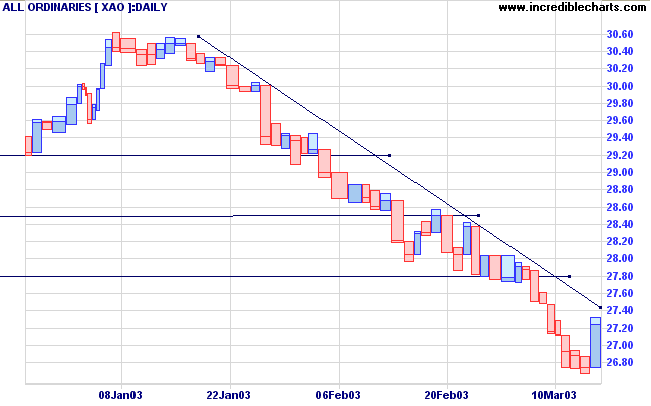
The All Ordinaries rallied strongly, closing 51 points higher at
2724 on higher volume. This is just a counter-trend at this
stage; the intermediate and primary trends are down. The next
support level is just below 2400.
MACD (26,12,9) is below its signal line; Slow Stochastic (20,3,3) is above; Twiggs Money Flow (21) signals distribution.
MACD (26,12,9) is below its signal line; Slow Stochastic (20,3,3) is above; Twiggs Money Flow (21) signals distribution.
Sector Analysis
Changes are highlighted in bold.
Changes are highlighted in bold.
- Energy [XEJ] - stage 4 (RS is level)
- Materials [XMJ] - stage 2 (RS is rising)
- Industrials [XNJ] - stage 4 (RS is falling)
- Consumer Discretionary [XDJ] - stage 1 (RS is level)
- Consumer Staples [XSJ] - stage 4 (RS is level)
- Health Care [XHJ] - stage 4 (RS is falling)
- Property Trusts [XPJ] - stage 2 (RS is rising)
- Financial excl. Property Trusts [XXJ] - stage 4 (RS is falling)
- Information Technology [XIJ] - stage 4 (RS is falling)
- Telecom Services [XTJ] - stage 4 (RS is falling)
- Utilities [XUJ] - stage 2 (RS is rising)
On the 3-month sectors chart Utilities is the only sector that is
positive.
The weakest sectors are Information Technology, Health Care and Consumer Discretionary.
The weakest sectors are Information Technology, Health Care and Consumer Discretionary.
Sectors: Relative Strength
A stock screen of the ASX 200 using % Price Move (1 month: +5%) returned the lowest number yet: 8 stocks (compared to 99 on August 23, 2002; and 10 on October 4, 2002).
A stock screen of the ASX 200 using % Price Move (1 month: +5%) returned the lowest number yet: 8 stocks (compared to 99 on August 23, 2002; and 10 on October 4, 2002).
Market strategy
For further guidance see Understanding the Trading Diary.
For further guidance see Understanding the Trading Diary.
Short-term: Avoid new entries. Slow Stochastic and MACD are on
opposite sides of their respective signal lines.
Medium-term: Avoid new entries.
Long-term: Wait for confirmation of the
bottom reversal signal.
Colin Twiggs
Engulfed by fear and suspicion,
we try desperately to invent ways out,
plan how to avoid
the obvious danger that threatens us so terribly.
Yet we're mistaken, that's not the danger ahead:
Another disaster, one we never imagined,
suddenly, violently, descends upon us,
and finding us unprepared - there's no time now -
sweeps us away.
- C. P. Cavafy: Things Ended
Back Issues
Click here to access the
Trading Diary Archives.
Back Issues
Access the Trading Diary Archives.