Market Statistics
The new Premium data will include market statistics:
New Highs/Lows, Advances/Declines and Advance/Decline Volume.
The new Premium data will include market statistics:
New Highs/Lows, Advances/Declines and Advance/Decline Volume.
Trading Diary
March 12, 2003
These extracts from my daily trading diary are
intended to illustrate the techniques used in short-term trading
and should not be interpreted as investment advice. Full terms
and conditions can be found at Terms
of Use .
USA
After testing the 7500 support level the Dow rallied to close
0.3% up at 7552. Strong volume increases the likelihood of a
consolidation.
The intermediate cycle is down; the next support level is at 7500.
The primary trend is down.
The Nasdaq Composite made a similar reversal to close up 8 points at 1279.
The intermediate trend is down, with the next support level at 1200.
The primary trend is up; a fall below 1108 will signal a reversal.
The S&P 500 mimicked the Dow, closing up 4 points at 804.
The intermediate trend is down.
The primary trend is down; the next support level is at 768.
The Chartcraft NYSE Bullish % Indicator is at 38% (March 11).
Oil price soars
Crude oil prices approach $US 40 barrel as government data shows falling supplies. (more)
Crude oil prices approach $US 40 barrel as government data shows falling supplies. (more)
Intel's new chip
The chip-maker unveils a new wireless technology chip for laptops, called the Centrino. (more)
The chip-maker unveils a new wireless technology chip for laptops, called the Centrino. (more)
Gold
New York (16.50): Spot gold is down 440 cents at $US 345.50.
New York (16.50): Spot gold is down 440 cents at $US 345.50.
ASX Australia
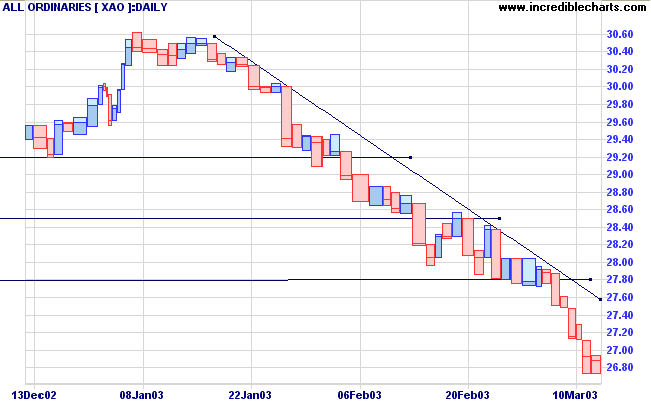
The All Ordinaries closed 5 points lower at 2687. The weak close
and higher volume signal that some consolidation is likely. The
next support level is just below 2400.
MACD (26,12,9) is below its signal line; Slow Stochastic (20,3,3)
crossed to above; Twiggs Money Flow signals distribution.
Wattyl [WYL]
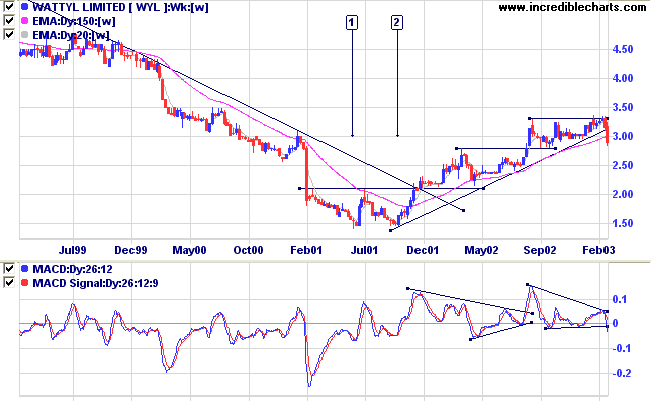
After a double bottom at [1] and [2] WYL commenced a slow stage 2 up-trend. Price has now broken below the trendline on strong volume.
Relative Strength (price ratio: xao) is falling; Twiggs Money Flow and MACD show bearish divergences.
Chemical stocks (ORI, SYM and NUF) are generally bearish.
After a double bottom at [1] and [2] WYL commenced a slow stage 2 up-trend. Price has now broken below the trendline on strong volume.
Relative Strength (price ratio: xao) is falling; Twiggs Money Flow and MACD show bearish divergences.
Chemical stocks (ORI, SYM and NUF) are generally bearish.
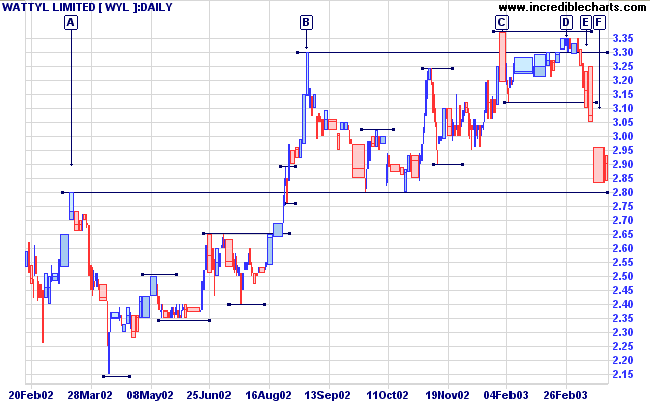
Wattyl made a false break at [C], closing back below the previous
high. Volume then dried up on the next rally at [D], signaling
weakness, and was followed by a fall below the first support
level at [E].
WYL then gapped down to [F] but left a long shadow, closing at the day's high, signaling short-term exhaustion. The inside day following indicates that some consolidation above the 2.80 support level can be expected.
A break below 2.80 will be a strong bear signal.
WYL then gapped down to [F] but left a long shadow, closing at the day's high, signaling short-term exhaustion. The inside day following indicates that some consolidation above the 2.80 support level can be expected.
A break below 2.80 will be a strong bear signal.
Market strategy
For further guidance see Understanding the Trading Diary.
For further guidance see Understanding the Trading Diary.
Short-term: Short if the All Ordinaries falls below 2673. Slow
Stochastic and MACD are on opposite sides of their respective
signal lines.
Medium-term: Avoid new entries.
Long-term: Wait for confirmation of the
bottom reversal signal.
Colin Twiggs
If you can trust yourself when all men doubt you
But make allowance for their doubting too
- Rudyard Kipling: IF
Back Issues
Click here to access the
Trading Diary Archives.
Back Issues
Access the Trading Diary Archives.