|
|
|
WineOrb, Australia's premium fine wine
broker, are offering a free Masterclass for you and your
partner, to show you what to look for when making an
investment in wine. Complete the form on our site and tell us in less than 25 words why you would like to attend. The best entries will be invited to join us at the Masterclass on the 16th May 2003. Click here to enter. |
Trading Diary
March 5, 2003
These extracts from my daily trading diary are
intended to illustrate the techniques used in short-term trading
and should not be interpreted as investment advice. Full terms
and conditions can be found at Terms
of Use .
USA
The Dow dropped gained 0.9% to close at 7775 on higher volume.
The intermediate cycle is down; the next support level is at
7500.
The primary trend is down.
The Nasdaq Composite recovered 0.5% to close at 1314. The intermediate trend is down, with the next support level at 1200.
The primary trend is up.
The S&P 500 gained 8 points to close at 829. The intermediate trend is down; the next support level is at 768.
The primary trend is down.
The Chartcraft NYSE Bullish % Indicator is at 40% (March 4).
The primary trend is down.
The Nasdaq Composite recovered 0.5% to close at 1314. The intermediate trend is down, with the next support level at 1200.
The primary trend is up.
The S&P 500 gained 8 points to close at 829. The intermediate trend is down; the next support level is at 768.
The primary trend is down.
The Chartcraft NYSE Bullish % Indicator is at 40% (March 4).
The falling $$
Pro's and con's of a weak US dollar. (more)
Pro's and con's of a weak US dollar. (more)
Gold
New York (17.30): Spot gold is up 90 cents at $US 353.30.
New York (17.30): Spot gold is up 90 cents at $US 353.30.
ASX Australia
The All Ordinaries broke through support, closing down 37 points
at 2750 on higher volume.
Slow Stochastic (20,3,3) is above its signal line; MACD (26,12,9) has crossed back below. Twiggs Money Flow continues to show a small bullish divergence.
Slow Stochastic (20,3,3) is above its signal line; MACD (26,12,9) has crossed back below. Twiggs Money Flow continues to show a small bullish divergence.
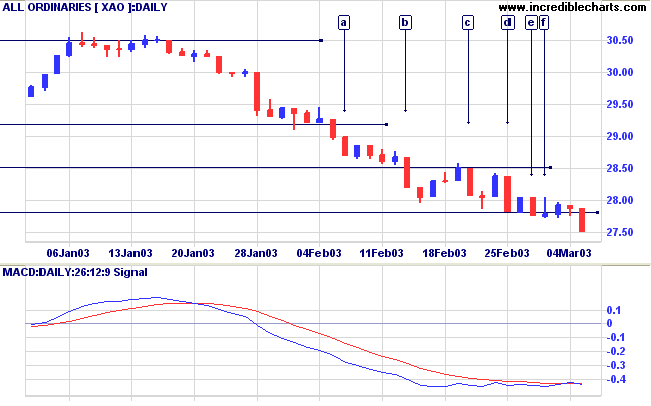
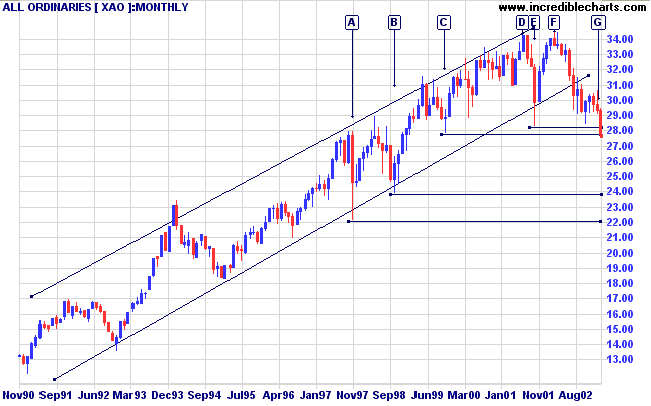
We now see a clear break below the 2850 to 2779 support band.
Unless there is an immediate reversal, we are in "bear country":
the next support level is just below 2400 at [B]; and the target
for the double top pattern, [D] to [F], is close by at 2200, the
low of [A].
Capral Aluminium [CAA]
Last covered on December 5, 2002.
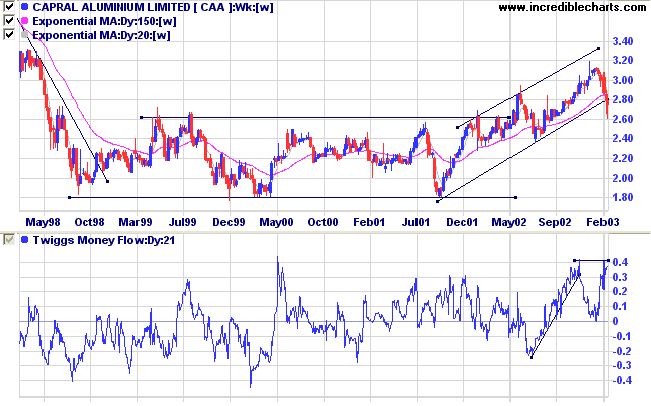
CAA formed a promising broad base over more than three years before breaking upwards in 2002, commencing an up-trend. Price has now broken below the trendline, signaling weakness. The Dow Aluminum Index is in a down-trend.
Relative Strength (price ratio: xao) is rising, but 21-day Twiggs Money Flow shows a bearish divergence and MACD has fallen sharply.
Last covered on December 5, 2002.
CAA formed a promising broad base over more than three years before breaking upwards in 2002, commencing an up-trend. Price has now broken below the trendline, signaling weakness. The Dow Aluminum Index is in a down-trend.
Relative Strength (price ratio: xao) is rising, but 21-day Twiggs Money Flow shows a bearish divergence and MACD has fallen sharply.
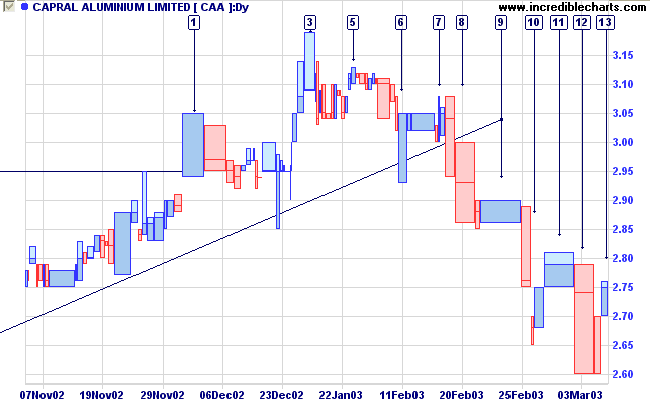
On the equivolume chart, CAA lost momentum after the upward gap
at [1]. After a period of consolidation the stock attempted a
weak rally to [3]: volume was thin and closes were low. Another
period of consolidation followed before an even weaker rally at
[5]. The reversal at [6] showed some buying support but the
over-square bar two days later showed sellers entering the
market.
The stock is clearly in a down-trend but closes on the downward bars are generally weak and we can observe heavy volume in the counter-trends at [9] and [11]. Volume has dried up at [13] and, if this continues, we should see the down-trend accelerate.
The stock is clearly in a down-trend but closes on the downward bars are generally weak and we can observe heavy volume in the counter-trends at [9] and [11]. Volume has dried up at [13] and, if this continues, we should see the down-trend accelerate.
If price breaks below the 2.60 - 2.50 support band (on the weekly
chart), we are likely to see a re-test of the 1.80 support level.
Market strategy
For further guidance see Understanding the Trading Diary.
For further guidance see Understanding the Trading Diary.
Short-term: Short if the All Ords is below 2750. Slow Stochastic
and MACD are on opposite sides of their respective signal lines;
the indicators appear to be whipsawing.
Medium-term: Avoid new entries.
Long-term: Wait for confirmation of the
bottom reversal signal.
Colin Twiggs
Do not be desirous of having things done quickly. Do not look
at small advantages.
Desire to have things done quickly prevents their being done
thoroughly.
Looking at small advantages prevents great affairs from being
accomplished.
- The Analects of Confucius
Back Issues
Click here to access the
Trading Diary Archives.
Back Issues
Access the Trading Diary Archives.