Full Member Version
We are making good progress
and will announce a start date shortly.
Trading Diary
February 26, 2003
These extracts from my daily trading diary are
intended to illustrate the techniques used in short-term trading
and should not be interpreted as investment advice. Full terms
and conditions can be found at Terms
of Use .
USA
The Dow formed an inside day, closing down 1.3%
at 7806 on above-average volume. The next support level is
7500.
The primary trend is down.
The Nasdaq Composite closed down 1.9% at 1303. The next support level is at 1200.
The primary trend is up.
The S&P 500 also broke below congestion, closing 11 points down at 827. The next support level is at 768.
The primary trend is down.
The Chartcraft NYSE Bullish % Indicator dropped to 40% (February 25).
The primary trend is down.
The Nasdaq Composite closed down 1.9% at 1303. The next support level is at 1200.
The primary trend is up.
The S&P 500 also broke below congestion, closing 11 points down at 827. The next support level is at 768.
The primary trend is down.
The Chartcraft NYSE Bullish % Indicator dropped to 40% (February 25).
Iraq
The market is still unsettled by prospects of war with Iraq, with Turkey pulling out its oil tank trucks and Hans Blix saying that "Iraq could do more" to cooperate. (more)
The market is still unsettled by prospects of war with Iraq, with Turkey pulling out its oil tank trucks and Hans Blix saying that "Iraq could do more" to cooperate. (more)
Gold
New York (17.21): Spot gold is back up 300 cents at $US 354.40.
New York (17.21): Spot gold is back up 300 cents at $US 354.40.
ASX Australia
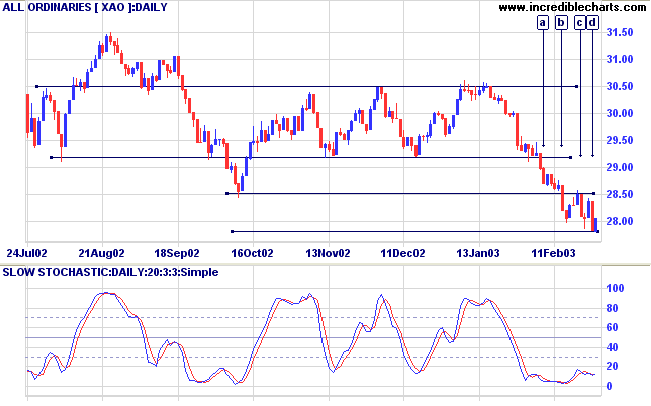
The All Ordinaries closed up 24 points at 2804 on lower volume.
Higher volume on the declines, [a] to [d], signal trend strength
and the 2779 support level will be severely tested over the next
few days.
Slow Stochastic (20,3,3) crossed to above its signal line; MACD (26,12,9) is below. Twiggs Money Flow still shows a small bullish divergence.
Slow Stochastic (20,3,3) crossed to above its signal line; MACD (26,12,9) is below. Twiggs Money Flow still shows a small bullish divergence.
Catching a falling knife
Bear markets generally have three stages:
Bear markets generally have three stages:
- Abandonment of the hopes and expectations that sustained inflated prices.
- Prices decline in response to disappointing earnings.
- Distress selling follows as speculators attempt to close out their positions and securities are sold without regard to their true value.
We have certainly witnessed the first two stages over the past
months, with one sector after another trending downwards. But how
do we identify the third stage?
Distress selling is the same as a downward spike: wide daily falls and heavy volume, frequently accompanied by gaps. IAG displays a good example at [1] to [2] below.
Volume must be sufficient for control to pass from sellers, who bought at far higher prices, to buyers who have bought at low prices in expectation of making a gain, relieving selling pressure on the stock.
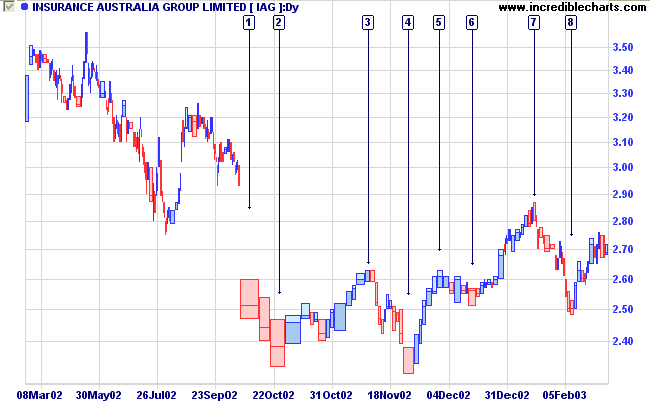
The downward spike is often followed by a sharp reversal [3],
drawing in eager "bottom-feeders". V-shaped bottoms are prone to
failure and most return [4] to test the lows established by the
initial spike. Traders who trade off initial reversals need to
work in short time frames and with tight stops - this can be
hazardous to your capital.
Less experienced traders should stick to trading off broad bases,
they are far more reliable.
Remember: The broader the base - the bigger the move.
Remember: The broader the base - the bigger the move.
Market strategy
For further guidance see Understanding the Trading Diary.
For further guidance see Understanding the Trading Diary.
Short-term: Avoid new entries. Slow Stochastic and MACD are on
opposite sides of their respective signal lines.
Medium-term: Avoid new entries.
Long-term: Wait for confirmation of the
bottom reversal signal.
Colin Twiggs
Through the release of atomic energy, our generation has
brought into the world
the most revolutionary force since prehistoric man's
discovery of fire.
This basic force of the universe cannot be fitted into
the outmoded concept
of narrow nationalisms.
- Albert Einstein
Back Issues
Click here to access the
Trading Diary Archives.
Back Issues
Access the Trading Diary Archives.