Full Member Version
We are making good progress
and will announce a start date shortly.
One area that is likely to be delayed is dividend data
- we have to find another data supplier due to reliability issues.
Trading Diary
February 25, 2003
These extracts from my daily trading diary are
intended to illustrate the techniques used in short-term trading
and should not be interpreted as investment advice. Full terms
and conditions can be found at Terms
of Use .
USA
After breaking below the congestion zone at the
opening, the Dow rallied after lunch to close up 0.6% at 7909 on
higher volume. The next support level is 7500.
The primary trend is down.
The Nasdaq Composite mirrored the Dow, closing up 0.5% at 1328.
The primary trend is up.
The S&P 500 repeated the story, breaking below congestion and then rallying back up to close at 838. The next support level is at 768.
The primary trend is down.
The Chartcraft NYSE Bullish % Indicator is at 42% (February 24).
The primary trend is down.
The Nasdaq Composite mirrored the Dow, closing up 0.5% at 1328.
The primary trend is up.
The S&P 500 repeated the story, breaking below congestion and then rallying back up to close at 838. The next support level is at 768.
The primary trend is down.
The Chartcraft NYSE Bullish % Indicator is at 42% (February 24).
Consumer confidence at 9-year low
The Conference Board index of consumer confidence dropped to 64 from 78.8 in January. (more)
The Conference Board index of consumer confidence dropped to 64 from 78.8 in January. (more)
Gold
New York (16.45): Spot gold is back down 540 cents at $US 351.70.
New York (16.45): Spot gold is back down 540 cents at $US 351.70.
ASX Australia
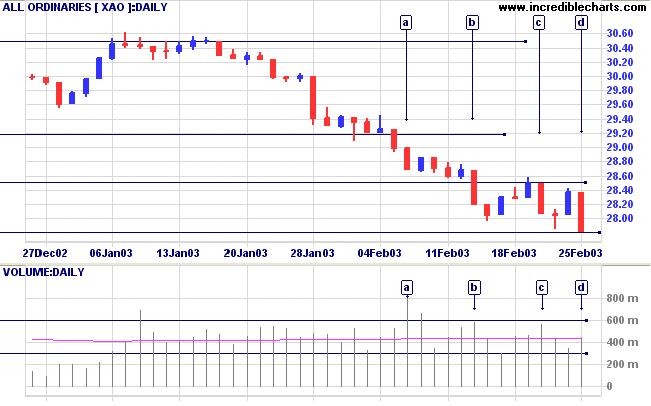
The All Ordinaries closed 2% down at 2780, testing support from
October 1999. Higher volume on the declines, [a] to [d], signal
trend strength. The support level will be severely tested over
the next few days.
Slow Stochastic (20,3,3) is below its signal line; MACD (26,12,9) is below. Twiggs Money Flow still shows a small bullish divergence.
Slow Stochastic (20,3,3) is below its signal line; MACD (26,12,9) is below. Twiggs Money Flow still shows a small bullish divergence.
CSL Limited [CSL]
Last covered on December 2, 2002.
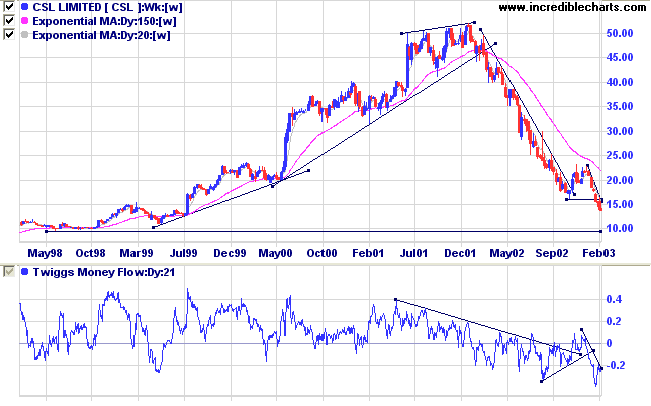
Another stock from the weak Health Care sector, CSL formed a stage 3 top in 2001 after a strong up-trend. The ensuing down-trend was even faster, falling to 16.00 at the end of November before a brief rally to 23.00. The stock then formed a double top, a strong continuation signal in a down trend, before resuming the stage 4 decline.
Relative Strength (price ratio: xao) is weakening, Twiggs Money Flow signals strong distribution and MACD is bearish.
Last covered on December 2, 2002.
Another stock from the weak Health Care sector, CSL formed a stage 3 top in 2001 after a strong up-trend. The ensuing down-trend was even faster, falling to 16.00 at the end of November before a brief rally to 23.00. The stock then formed a double top, a strong continuation signal in a down trend, before resuming the stage 4 decline.
Relative Strength (price ratio: xao) is weakening, Twiggs Money Flow signals strong distribution and MACD is bearish.
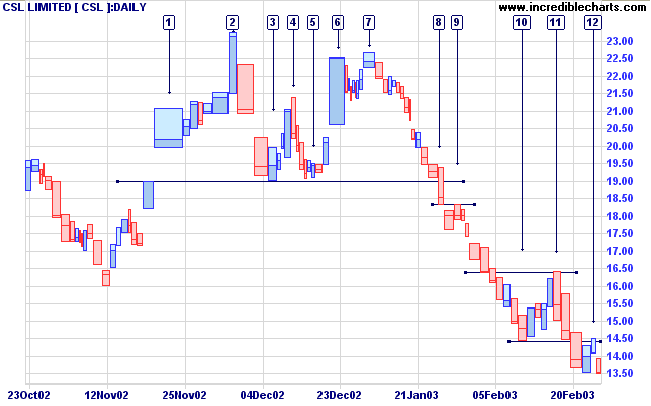
Equivolume shows completion of the recent double top at [8]. This
also closed the gap at [1], reinforcing the signal. The short
pull-back at [9] signaled strong selling pressure. The next
counter-trend at [11] was stronger, but failed to test resistance
at 17.60. The counter-trend at [12] only lasted one day, briefly
testing resistance at the low of [10], but on low volume with a
weak close, signaling trend strength.
The down-trend is strong and the next major support level is at 10.00 (on the weekly chart).
The down-trend is strong and the next major support level is at 10.00 (on the weekly chart).
Market strategy
For further guidance see Understanding the Trading Diary.
For further guidance see Understanding the Trading Diary.
Short-term: Short. Slow Stochastic and MACD are below their
respective signal lines.
Medium-term: Avoid new entries.
Long-term: Wait for confirmation of the
bottom reversal signal.
Colin Twiggs
Whatever failures I have known, whatever errors I have
committed,
whatever follies I have witnessed in private and public
life
have been the consequence of action without
thought.
- Bernard Baruch
Back Issues
Click here to access the
Trading Diary Archives.
Back Issues
Access the Trading Diary Archives.