Chart Forum Troubleshooting
Those readers who have had difficulty registering for the Chart Forum,
or uploading chart images to their posts:
Please refer to Forum Troubleshooting for assistance.
Trading Diary
February 18, 2003
These extracts from my daily trading diary are
intended to illustrate the techniques used in short-term trading
and should not be interpreted as investment advice. Full terms
and conditions can be found at Terms
of Use .
USA
The Dow rallied 1.6% to close at 8041 but on
light volume.
If the rally carries above the first resistance level at 8189, this will signal that the down-trend (secondary/intermediate cycle) is weak.
The primary trend is down.
The Nasdaq Composite gapped up 2.8% to close at 1346.
The primary trend is up.
The S&P 500 gained 16 points to close at 851.
The first resistance level is 868.
The Chartcraft NYSE Bullish % Indicator is at 42% (February 14).
Gold
New York (16.45): Spot gold is down 310 cents at $US 343.60.
New York (16.45): Spot gold is down 310 cents at $US 343.60.
ASX Australia
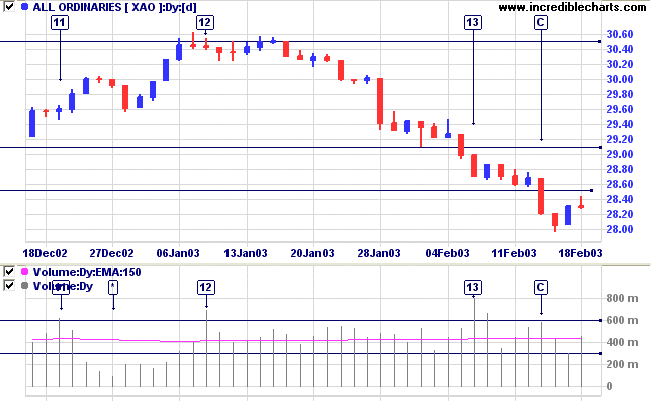
The All Ordinaries failed to hold on to further gains, closing
back down at 2829 on average volume.
If the index moves lower on Wednesday, this will signal that the down-trend is still strong and threaten the 2779 support level.
Slow Stochastic (20,3,3) is above its signal line; MACD (26,12,9) is below; Twiggs Money Flow signals distribution.
If the index moves lower on Wednesday, this will signal that the down-trend is still strong and threaten the 2779 support level.
Slow Stochastic (20,3,3) is above its signal line; MACD (26,12,9) is below; Twiggs Money Flow signals distribution.
Santos [STO]
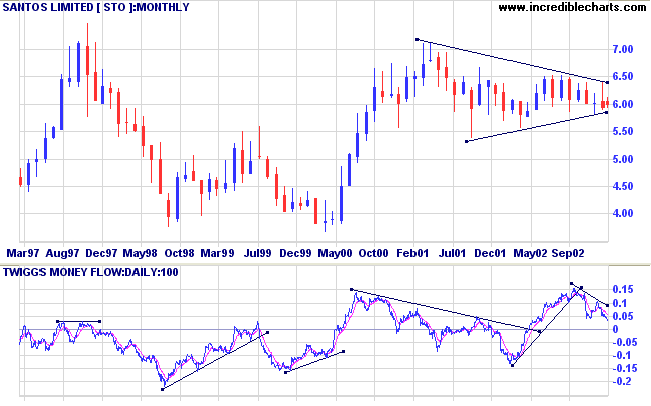
The Energy Index is in a stage 4 down-trend while Santos has been forming a stage 3 top over the past 2 years, in the form of a symmetrical triangle.
I have plotted a longer 100-day Twiggs Money Flow to highlight the long-term cycle of accumulation/distribution. This highlights several useful divergences at reversals in the primary trend. The indicator now signals weakness.
Relative Strength (price ratio:xao) is moving sideways; while MACD is bearish; and 20-day Twiggs Money Flow signals distribution.
Within the triangle STO is ranging between 6.40 and 5.85. The
false break at [5] was on low volume and failed to close below
the support level. There was a strong decline down to [7] but
volume on the counter-trend at [8] is high and has dried up on
the following decline. This makes it likely that we will see
another rally up to the resistance level at 6.40.
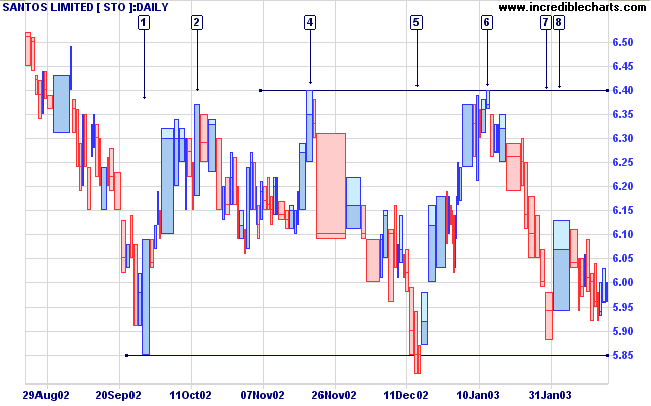
In the longer-term, a break below 5.85 that then respects the new
resistance level, will be a strong bear signal.
A break above 6.40 would be bullish. Again, it would be prudent
to wait for price to respect the support level before taking new
entries.
Market strategy
For further guidance see Understanding the Trading Diary.
For further guidance see Understanding the Trading Diary.
Short-term: Avoid new entries. Slow Stochastic and MACD are on
opposite sides of their respective signal lines.
Medium-term: Avoid new entries.
Long-term: Wait for confirmation of the
bottom reversal signal.
Colin Twiggs
I have found that the greatest traders are the
ones who are most afraid of the markets.
My fear of the markets has forced me to hone my timing with
great precision.
- Mark Weinstein explains his high percentage of winning
trades;
from Market Wizards by Jack Schwager.
Back Issues
Click here to access the
Trading Diary Archives.
Back Issues
Access the Trading Diary Archives.