Chart Forum Troubleshooting
Those readers who have had difficulty registering for the Chart Forum,
or uploading chart images to their posts:
Please refer to Forum Troubleshooting for assistance.
Trading Diary
February 14, 2003
These extracts from my daily trading diary are
intended to illustrate the techniques used in short-term trading
and should not be interpreted as investment advice. Full terms
and conditions can be found at Terms
of Use .
USA
The Dow rallied 2.0% off its low to close at
7908 on higher volume.
The index is likely to test the 7500 support level.
The primary trend is down.
The Nasdaq Composite rallied 2.5% to close at 1310.
The next major support level is at 1200.
The primary trend is up (the last low was 1108, the last high 1521).
The S&P 500 gained 17 points to close at 834.
The index has formed a base between 768 and 964 but appears headed for a re-test of the support level.
The Chartcraft NYSE Bullish % Indicator dropped to 42% (February 13).
Production increase
Industrial production increased 0.7% in January, the largest increase in two years. (more)
Industrial production increased 0.7% in January, the largest increase in two years. (more)
Consumer confidence falls
The University of Michigan consumer sentiment index fell to 79.2, from 82.4 in January. (more)
Back Issues
The University of Michigan consumer sentiment index fell to 79.2, from 82.4 in January. (more)
Gold
New York (16.00): Spot gold closed almost 600 cents down at $US 351.30.
New York (16.00): Spot gold closed almost 600 cents down at $US 351.30.
ASX Australia
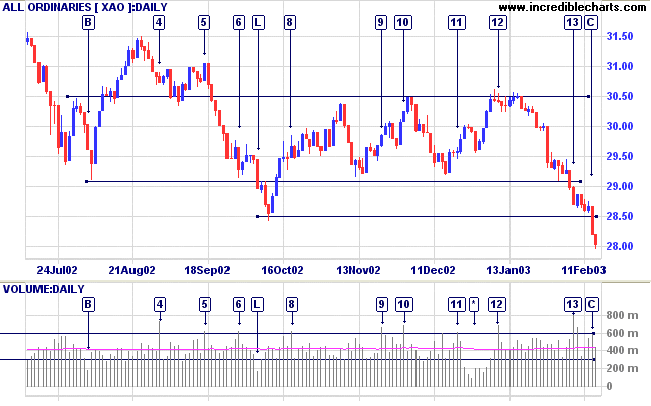
The All Ordinaries continues to fall steeply, closing at
2804 on average volume.
We will see over the next few days if the lower end of the 2850 to 2779 support band is able to hold.
Slow Stochastic (20,3,3) whipsaws around its signal line; MACD (26,12,9) is below; Twiggs Money Flow signals distribution.
We will see over the next few days if the lower end of the 2850 to 2779 support band is able to hold.
Slow Stochastic (20,3,3) whipsaws around its signal line; MACD (26,12,9) is below; Twiggs Money Flow signals distribution.
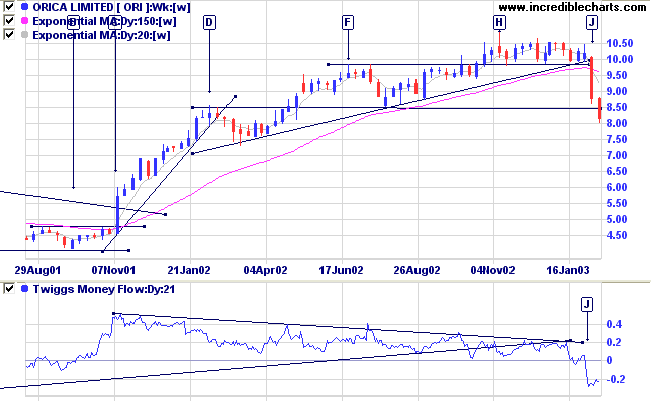
Orica Limited [ORI]
Last covered on February 5, 2003.
After forming a descending triangle pattern at [H] ORI completed the pattern with a downward break at [J]. The stock has now broken through the 8.50 support level.
Relative Strength (price ratio:xao) and MACD are bearish; Twiggs Money Flow signals distribution.
Last covered on February 5, 2003.
After forming a descending triangle pattern at [H] ORI completed the pattern with a downward break at [J]. The stock has now broken through the 8.50 support level.
Relative Strength (price ratio:xao) and MACD are bearish; Twiggs Money Flow signals distribution.
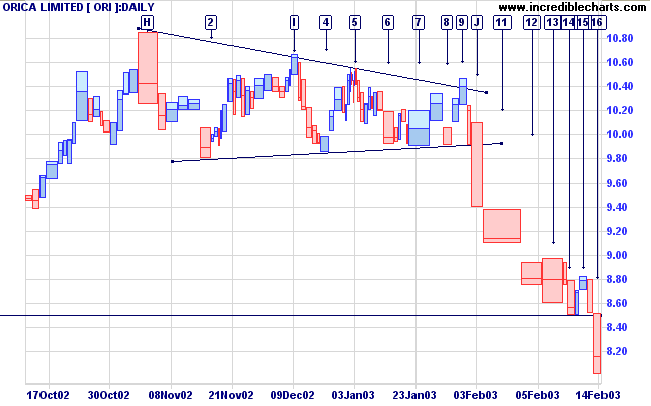
The pull back at the 8.50 support level only lasted one
day [15] on weak volume. The low is taken out two days
later at [16]. This signals a very fast down-trend,
likely to reach the next support level at 7.50.
Sector Analysis
Changes are highlighted in bold.
Changes are highlighted in bold.
- Energy [XEJ] - stage 4 (RS is rising)
- Materials [XMJ] - stage 2 (RS is rising)
- Industrials [XNJ] - stage 4 (RS is falling)
- Consumer Discretionary [XDJ] - stage 2 (RS is level)
- Consumer Staples [XSJ] - stage 4 (RS is rising)
- Health Care [XHJ] - stage 4 (RS is falling)
- Property Trusts [XPJ] - stage 2 (RS is rising)
- Financial excl. Property Trusts [XXJ] - stage 4 (RS is falling)
- Information Technology [XIJ] - stage 4 (RS is level)
- Telecom Services [XTJ] - stage 4 (RS is level)
- Utilities [XUJ] - stage 2 (RS is rising)
Sectors: Relative Strength
A stock screen of the ASX 200 using % Price Move (1 month: +5%) returned 16 stocks (compared to 99, August 23rd and 10 on October 4th).
There were no prevalent sectors.
A stock screen of the ASX 200 using % Price Move (1 month: +5%) returned 16 stocks (compared to 99, August 23rd and 10 on October 4th).
There were no prevalent sectors.
Market strategy
For further guidance see Understanding the Trading Diary.
For further guidance see Understanding the Trading Diary.
Short-term: Short. Slow Stochastic and MACD are below
their respective signal lines.
Medium-term: Avoid new entries.
Long-term: Wait for confirmation of the
bottom reversal signal.
Colin Twiggs
In a time of drastic change it is the
learners who inherit the future.
The learned usually find themselves equipped to live in
a world that no longer exists.
- Eric Hoffer
Back Issues
Click here to access the
Trading Diary Archives.
Back Issues
Access the Trading Diary Archives.