2003 Membership
The reduced subscription to existing members
will run for at least 4 weeks
after all the data is in place and the free trial commences.
Subscription/Registration forms will be available from the start of the free trial period.
We will keep you informed of progress.
after all the data is in place and the free trial commences.
Subscription/Registration forms will be available from the start of the free trial period.
We will keep you informed of progress.
Trading Diary
February 3, 2003
These extracts from my daily trading diary are
intended to illustrate the techniques used in short-term trading
and should not be interpreted as investment advice. Full terms
and conditions can be found at Terms
of Use .
USA
The Dow is still within the congestion pattern
of the last few days, closing up 0.7% at 8109 on lower
volume.
The index appears headed for a re-test of the 7500 support level. The primary trend is down.
The Nasdaq Composite closed up 3 points at 1323. The next major support level is at 1200.
The primary trend is up.
The S&P 500 also displays congestion, up 5 points at 860. The index appears headed for a re-test of support at 768.
The Chartcraft NYSE Bullish % Indicator is on a bull correction signal at 46% (January 31).
Manufacturing grows
The Institute of Supply Management index of manufacturing activity records a second month of growth. (more)
Back Issues
The Institute of Supply Management index of manufacturing activity records a second month of growth. (more)
Gold
New York (16:45): Spot gold has recovered to $US 371.10.
New York (16:45): Spot gold has recovered to $US 371.10.
ASX Australia
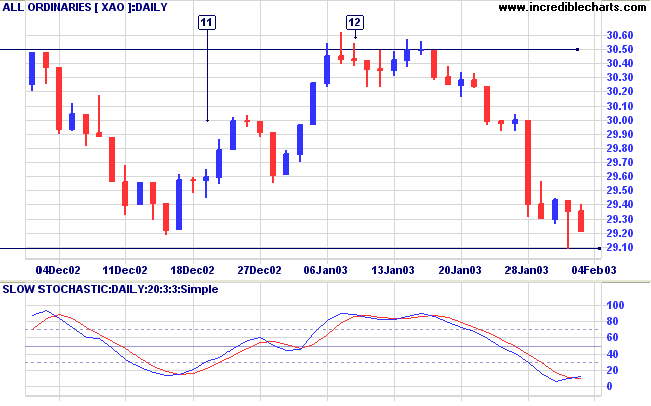
The All Ordinaries closed down 14 points at 2921 on lower
volume.
The index has, so far, failed to breach the 2915 support level.
Slow Stochastic (20,3,3) has crossed to above its signal line; MACD (26,12,9) is below; Twiggs Money Flow signals distribution.
The index has, so far, failed to breach the 2915 support level.
Slow Stochastic (20,3,3) has crossed to above its signal line; MACD (26,12,9) is below; Twiggs Money Flow signals distribution.
Foodland [FOA]
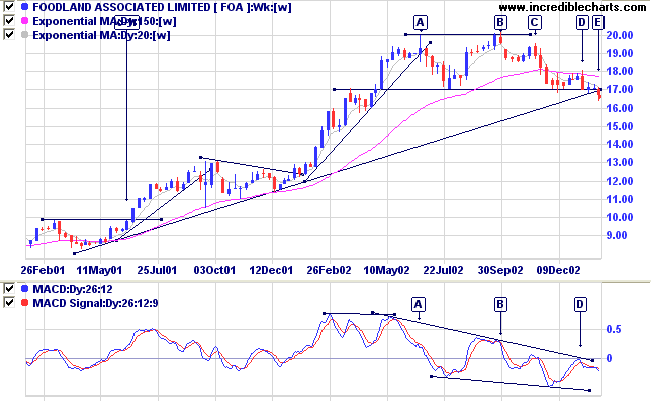
Last covered on January 22, 2003.
Foodland has completed a double top pattern at [A] and [B] with a break below the support level at [E]. The pattern may also be interpreted as a head and shoulders pattern, with the head at [B] and shoulders at [A] and [C]. Either way, [E] is a strong bear signal, especially as it also breaches the long-term trendline.
Relative Strength (price ratio: xao) is falling and Twiggs Money Flow signals distribution. MACD has completed a peak below zero; a further bear signal.
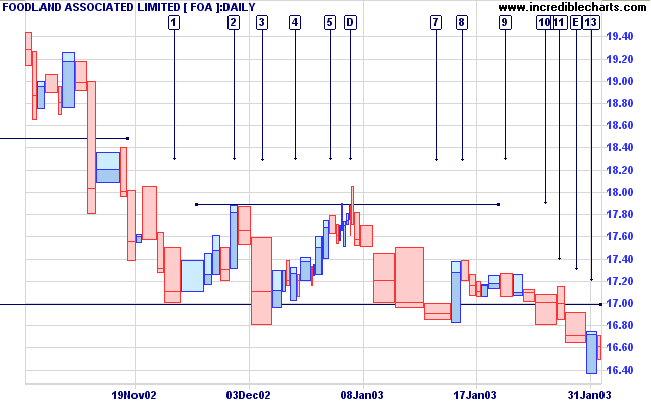
Because of a number of false breaks, including [3] and [7]
below, it is advisable to wait for price to respect the new
resistance level at 17.00. The
hammer reversal signal at [13], followed by an inside
day on low volume, signals that a pull-back may be
imminent. Bearish signs to look for on the pull-back are:
- the pull-back is of short duration (no more than 2/3 days);
- volume dries up on the rally;
- the daily range narrows near the resistance level.
Large volume at the resistance level will indicate an
increase in selling pressure. But this also indicates
continuing interest from buyers, as at [7], and may signal
further re-tests of the resistance level in the weeks
ahead.
Traders who want to short FOA should place a sell-stop
below the low of each day that conforms to at least 2 of
the above 3 criteria.
Market strategy
For further guidance see Understanding the Trading Diary.
For further guidance see Understanding the Trading Diary.
Short-term: Avoid new entries. The Slow Stochastic and MACD
are on opposite sides of their respective signal lines.
Medium-term: Avoid new entries.
Long-term: Wait for confirmation of the
bottom reversal signal.
Colin Twiggs
I know not how to aid you,
save in the assurance of one of mature age,
and much severe experience,
that you can not fail,
if you resolutely determine, that you will not.
- Abraham Lincoln: Letter to George Latham (1860)
save in the assurance of one of mature age,
and much severe experience,
that you can not fail,
if you resolutely determine, that you will not.
- Abraham Lincoln: Letter to George Latham (1860)
Back Issues
Click here to access the
Trading Diary Archives.
Back Issues
Access the Trading Diary Archives.