Predictions and Probabilities
A reader asked "How can you change your mind on
NCP so quickly?".
You can't afford to invest your ego in any position in the market. If the market moves against your position, you need to react quickly.
I do not believe in predictions, only in probabilities.
You can't afford to invest your ego in any position in the market. If the market moves against your position, you need to react quickly.
I do not believe in predictions, only in probabilities.
Trading Diary
January 30, 2003
These extracts from my daily trading diary are
intended to illustrate the techniques used in short-term trading
and should not be interpreted as investment advice. Full terms
and conditions can be found at Terms
of Use .
USA
The Dow closed down 2.0% at 7945 on lower
volume, forming an inside day. The index appears headed for a
re-test of the 7500 support level.
The primary trend is down.
The Nasdaq Composite fell 2.6% to close at 1322. The next major support level is at 1200.
The primary trend is up.
The S&P 500 lost 20 points to close at 844. The index appears headed for a re-test of support at 768.
The Chartcraft NYSE Bullish % Indicator is on a bull correction signal at 48% (January 29).
AOL
AOL Time-Warner report a record $US 98.7 billion loss for the year, writing down their investment in AOL and cable divisions. (more)
Rising unemployment
Rising claims for unemployment benefits signal a weakening labor market. (more)
Back Issues
AOL Time-Warner report a record $US 98.7 billion loss for the year, writing down their investment in AOL and cable divisions. (more)
Rising unemployment
Rising claims for unemployment benefits signal a weakening labor market. (more)
Gold
New York (16:45): After a short pull-back to 362.00 spot gold has soared to $US 370.80.
New York (16:45): After a short pull-back to 362.00 spot gold has soared to $US 370.80.
ASX Australia
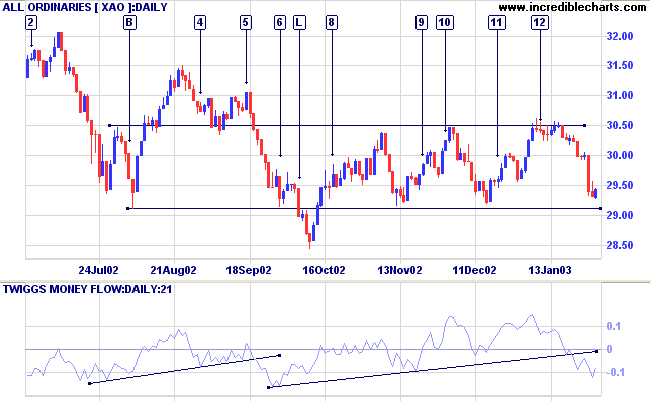
The All Ordinaries recovered 13 points to close at 2943 on
average volume.
The 2915 support level is likely to be severely tested over the next few days.
Slow Stochastic (20,3,3) and MACD (26,12,9) are below their signal lines; Twiggs Money Flow signals distribution.
The 2915 support level is likely to be severely tested over the next few days.
Slow Stochastic (20,3,3) and MACD (26,12,9) are below their signal lines; Twiggs Money Flow signals distribution.
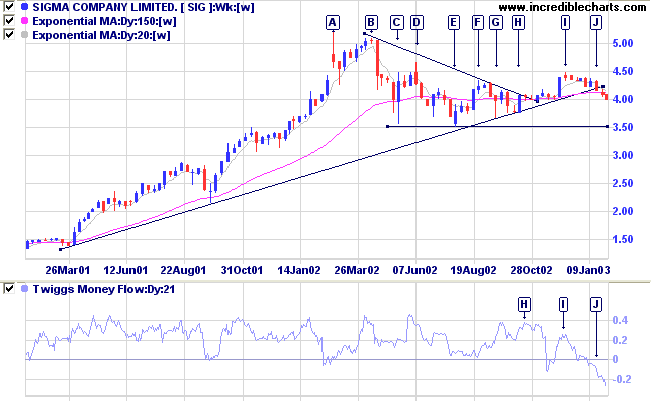
Sigma Company Limited [SIG]
Last covered on October 3, 2002.
SIG has been in a stage 3 top for the last year after a completed double top pattern at [A] and [B] was followed by a fall back to 3.50 at [C]. After a lower high at [D], the stock has been moving sideways, ranging between 3.50 and 4.30.
Recently, SIG broke its long-term trendline at [J] and Twiggs Money Flow signals strong distribution [J] after signaling strong accumulation for more than two years.
Relative Strength (price ratio: xao) is falling and MACD is bearish.
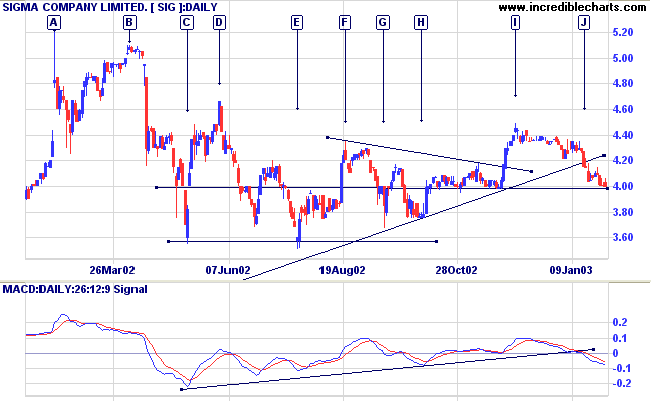
The daily chart displays a good example of a spike at [A]
followed by lower highs at [B], [D] and [F]. There was
a bullish breakout from a triangle at [I] but price then
retreated below the supporting trendline at [J].
Although there are bearish signs, SIG still has to break
below support at 4.00 and 3.50 before we can say it has
completed the top and entered a stage 4 down-trend.
Market strategy
For further guidance see Understanding the Trading Diary.
For further guidance see Understanding the Trading Diary.
Short-term: Take short entries. The Slow Stochastic and
MACD are below their respective signal lines.
Medium-term: Avoid new entries.
Long-term: Wait for confirmation of the
bottom reversal signal.
Colin Twiggs
....you find many people, reputed to be
intelligent, who are bullish because they have
stocks.
I do not allow my possessions - or my prepossessions either - to do any thinking for me.
That is why I repeat that I never argue with the tape.
- Edwin Lefevre: Reminiscences of a Stock Operator (1923)
I do not allow my possessions - or my prepossessions either - to do any thinking for me.
That is why I repeat that I never argue with the tape.
- Edwin Lefevre: Reminiscences of a Stock Operator (1923)
Back Issues
Click here to access the
Trading Diary Archives.
Back Issues
Access the Trading Diary Archives.