2003 Membership
The reduced subscription to existing members
will run for at least 4 weeks
after all the data is in place and the free trial commences.
Subscription/Registration forms will be available from the start of the free trial period.
We will keep you informed of progress.
after all the data is in place and the free trial commences.
Subscription/Registration forms will be available from the start of the free trial period.
We will keep you informed of progress.
Trading Diary
January 28, 2003
These extracts from my daily trading diary are
intended to illustrate the techniques used in short-term trading
and should not be interpreted as investment advice. Full terms
and conditions can be found at Terms
of Use .
USA
The Dow formed an inside day, closing up 1.2% at
8089 on above-average volume. The index appears headed for a
re-test of the 7500 support level.
The primary trend is down.
The Nasdaq Composite also formed an inside day, closing at 1342. The next major support level is at 1200.
The primary trend is up.
The S&P 500 closed up 11 points at 858; another inside day. The index appears headed for a re-test of support at 768.
The Chartcraft NYSE Bullish % Indicator has switched to a bull correction signal at 48% (January 27).
Consumer confidence falls
The Conference Board consumer confidence index falls to 79, the lowest level in 9 years. (more)
Back Issues
The Conference Board consumer confidence index falls to 79, the lowest level in 9 years. (more)
Gold
New York (15:30): Spot gold is holding at $US 369.30.
New York (15:30): Spot gold is holding at $US 369.30.
ASX Australia
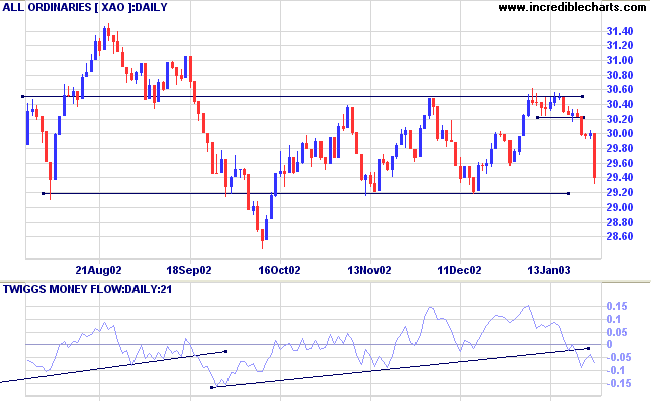
Increasing war rhetoric drove the All Ordinaries down more
than 50 points to close at 2941 on average volume.
Over the last 3 months the index has been forming a base between 2915 and 3050. The support level is likely to be severely tested over the next few days.
Slow Stochastic (20,3,3) and MACD (26,12,9) are below their signal lines; Twiggs Money Flow signals distribution.
Over the last 3 months the index has been forming a base between 2915 and 3050. The support level is likely to be severely tested over the next few days.
Slow Stochastic (20,3,3) and MACD (26,12,9) are below their signal lines; Twiggs Money Flow signals distribution.
Novogen [NRT]
Last covered on October 22, 2002.
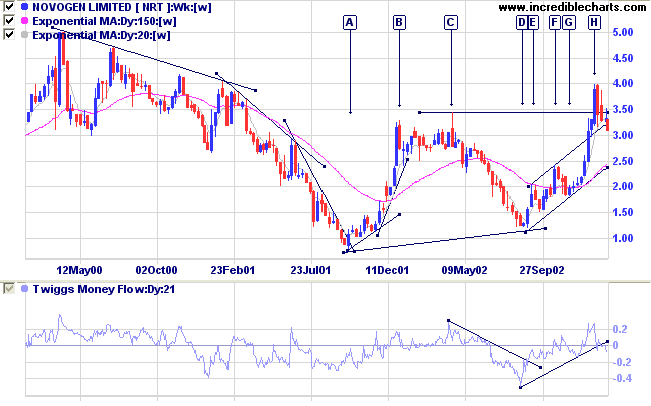
After a stage 4 down-trend to [A] NRT formed a higher low at [D] before completing a double bottom at [H] with a break above the high of [C]. The double bottom is normally a strong bullish signal but price has reversed back below the support level after spiking up to 4.00 at [H].
Note that spikes at [B] and [H] were both unsustainable and pulled back about 25% from their highs.
Relative Strength (price ratio: xao) and MACD are both bearish, while Twiggs Money Flow signals distribution after breaking below its trendline.
Last covered on October 22, 2002.
After a stage 4 down-trend to [A] NRT formed a higher low at [D] before completing a double bottom at [H] with a break above the high of [C]. The double bottom is normally a strong bullish signal but price has reversed back below the support level after spiking up to 4.00 at [H].
Note that spikes at [B] and [H] were both unsustainable and pulled back about 25% from their highs.
Relative Strength (price ratio: xao) and MACD are both bearish, while Twiggs Money Flow signals distribution after breaking below its trendline.
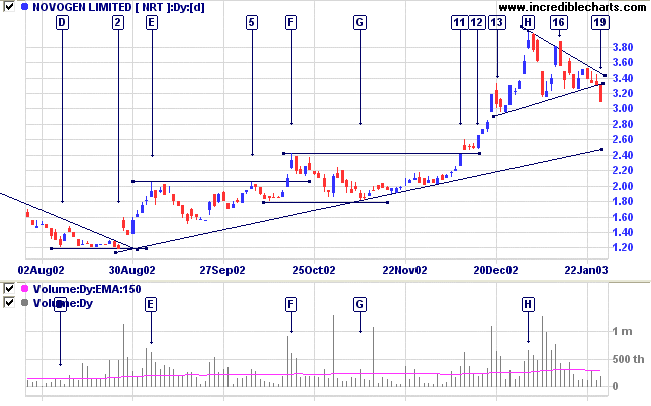
The daily chart shows a pennant forming at [H]. Normally
this is a bullish continuation pattern but here we have a
break below the pattern at [19]. Many traders will have
already been stopped out and the outcome may be a bull
trap.
The breakout at [19] is on low volume. It would be prudent
to wait until NRT has respected the lower trend line, to
ensure that this is not another false break, before taking
any short positions.
Market strategy
For further guidance see Understanding the Trading Diary.
For further guidance see Understanding the Trading Diary.
Short-term: Short. The Slow Stochastic and MACD are below
their respective signal lines.
Medium-term: Avoid new entries.
Long-term: Wait for confirmation of the
bottom reversal signal.
Colin Twiggs
The greater the laws and enactments, the
more thieves and robbers there will be.
- Lao Tse (c. 600 B.C. - 530 B.C.)
A state is better governed which has but few laws, and those laws strictly observed.
- Rene Descartes (1596-1650)
- Lao Tse (c. 600 B.C. - 530 B.C.)
A state is better governed which has but few laws, and those laws strictly observed.
- Rene Descartes (1596-1650)
Back Issues
Click here to access the
Trading Diary Archives.
Back Issues
Access the Trading Diary Archives.