Membership categories
In 2003 we plan to separate membership into two categories.
I see from discussion on the Chart Forum that some members would prefer to select the specific services that they require and omit the others.
What I may have failed to explain yesterday is that, whether we provide a service to 1 member or to 100 members, the cost is about the same. Hence our approach: If a member subscribes for one service, they will receive all the other services at no extra charge.
Please give us your feedback/suggestions at the Chart Forum.
Trading Diary
December 17, 2002
These extracts from my daily trading diary are
intended to illustrate the techniques used in short-term trading
and should not be interpreted as investment advice. Full terms
and conditions can be found at Terms
of Use .
USA
The Dow formed an inside day, closing down 1% at
8535 on higher volume. The down-trend may still re-test the 7500
and 7200 support levels.
The primary trend is down and will only reverse up if the average rises above 9130.
The Nasdaq Composite was down 0.6% at 1392.
The primary trend is up.
The S&P 500 formed an inside day, down 8 points at 902.
The primary trend is down.
The Chartcraft NYSE Bullish % Indicator appears stuck at 50% (December 16).
McDonalds
The Dow stalwart expects to take its first ever quarterly loss after a $US 435 million charge for store closures and job cuts. (more)
Gold
New York: Spot gold is up 40 cents at $US 336.70, after reaching 341.00 intra-day.
The Dow stalwart expects to take its first ever quarterly loss after a $US 435 million charge for store closures and job cuts. (more)
Gold
New York: Spot gold is up 40 cents at $US 336.70, after reaching 341.00 intra-day.
ASX Australia
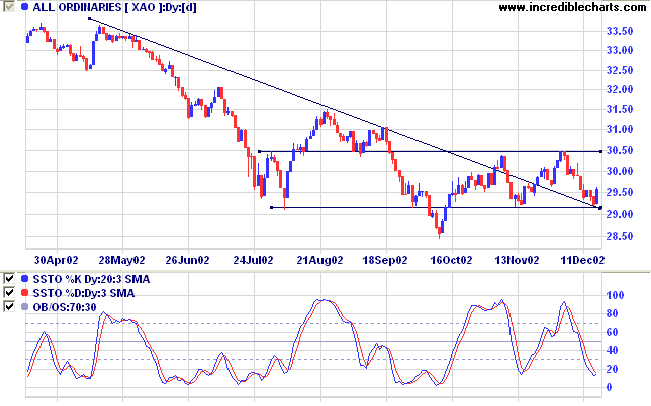
The All Ordinaries rallied sharply, up 35 points at 2957 on
higher volume. The market is ranging between 2915 and 3050,
building a broad base in the process. The index respected the
2915 support level and the downward trendline, so be on the
alert for further bull signals.
MACD (26,12,9) and Slow Stochastic (20,3,3) are below their signal lines, but the Slow Stochastic appears about to cross. Twiggs money flow is just above zero.
MACD (26,12,9) and Slow Stochastic (20,3,3) are below their signal lines, but the Slow Stochastic appears about to cross. Twiggs money flow is just above zero.
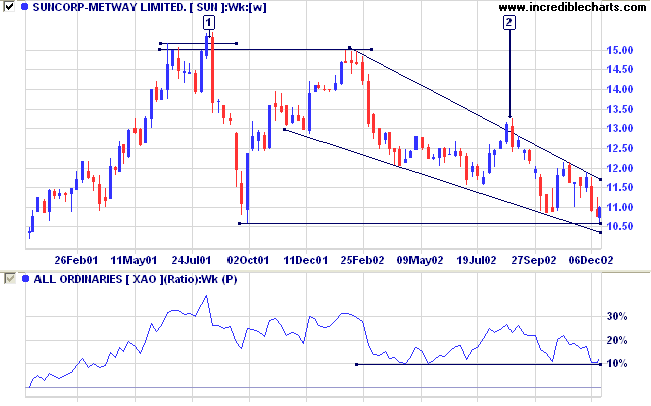
Suncorp Metway [SUN]
Last covered on August 29.
Last covered on August 29.
SUN formed a double top at [1], with a false break above the
previous high, before a sharp drop in September 2001. This was
followed by a re-test of resistance at 15.00 then a creeping
down-trend in the form of a falling wedge. Price is now testing
resistance at 10.60.
Relative strength (price ratio: xao) is holding above the support level. A break below support would be bearish.
Relative strength (price ratio: xao) is holding above the support level. A break below support would be bearish.
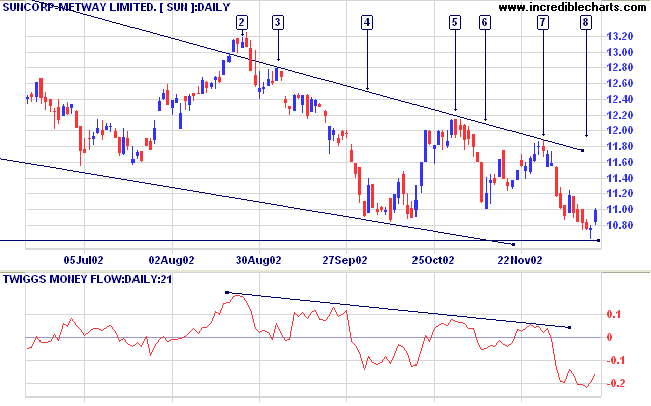
The falling wedge is open to varying interpretation because of
a false break above the trendline at [2]. Since then price has
respected the borders of the wedge, with no further breaks, and
has now respected the major support level at 10.60.
Twiggs Money Flow and MACD are bearish.
A break below support at 10.60 will be a bear signal, while a
break above the upper border of the wedge would be a strong
bull signal.
Market strategy
For further guidance see Understanding the Trading Diary.
For further guidance see Understanding the Trading Diary.
Short-term: Avoid new entries unless the index falls below
2915. The Slow Stochastic and MACD are below their respective
signal lines.
Medium-term: Avoid new entries.
Long-term: Wait for confirmation of the
bottom reversal signal.
Colin Twiggs
To study and not think is a waste.
To think and not study is dangerous.
- The Analects of Confucius: 2.15
To think and not study is dangerous.
- The Analects of Confucius: 2.15
Back Issues
Click here to access the
Trading Diary Archives.
Back Issues
Access the Trading Diary Archives.