Chart Forum:
Start New Thread
The Start New Thread link has been moved to the head of the Topics page.
Members previously had difficulty locating it on pages with large numbers of threads.
Trading Diary
November 26, 2002
These extracts from my daily trading diary are intended to
illustrate the techniques used in short-term trading and should
not be interpreted as investment advice. Full terms and
conditions can be found at Terms
of Use .
USA
The Dow fell 1.9% to close at 8676 on higher
volume, continuing the slow, creeping up-trend.
The primary trend will reverse (up) if the index rises above 9130.
The Nasdaq Composite Index lost 2.5% to close at 1444.
The primary trend is up.
The S&P 500 lost 19 points to close at 913.
The primary trend will complete a double bottom reversal if it rises above 965.
The Chartcraft NYSE Bullish % Indicator signals a bull alert at 48% (November 25).
Wall St faces $1 billion in fines
Merrill Lynch has already paid $100 million to settle conflict-of-interest charges. Other firms face even bigger fines for hyping analysts reports to win investment banking business. (more)
Gold
New York: Spot gold is down 10 cents at $US 317.60.
Merrill Lynch has already paid $100 million to settle conflict-of-interest charges. Other firms face even bigger fines for hyping analysts reports to win investment banking business. (more)
Gold
New York: Spot gold is down 10 cents at $US 317.60.
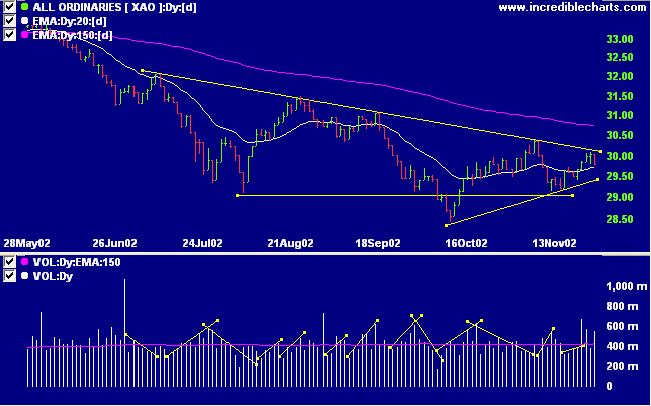
ASX Australia
The All Ordinaries closed sharply lower, 26 points down at 2979
on bearishly strong volume. The index must soon break out from
the symmetrical triangle formed over the last 5 months.
The primary trend will reverse if the index rises above 3150.
The MACD (26,12,9) and Slow Stochastic (20,3,3) are above their signal lines; Twiggs money flow is falling.
The primary trend will reverse if the index rises above 3150.
The MACD (26,12,9) and Slow Stochastic (20,3,3) are above their signal lines; Twiggs money flow is falling.
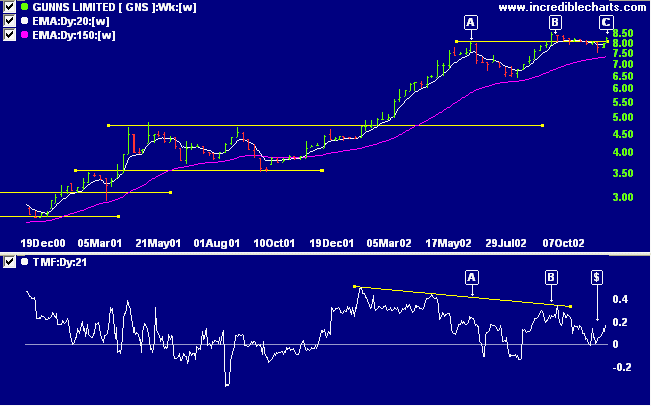
Gunns [GNS]
After a strong stage 2 up-trend GNS formed a bearish divergence on Twiggs money flow and MACD at [A] before a correction back to the 150-day MA. Price then rallied to a marginal new high at [B] before drifting lower to [C]. Twiggs money flow has made a bullish trough above the zero line [$], while MACD and Relative strength (price ratio: xao) are rising.
Back Issues
After a strong stage 2 up-trend GNS formed a bearish divergence on Twiggs money flow and MACD at [A] before a correction back to the 150-day MA. Price then rallied to a marginal new high at [B] before drifting lower to [C]. Twiggs money flow has made a bullish trough above the zero line [$], while MACD and Relative strength (price ratio: xao) are rising.
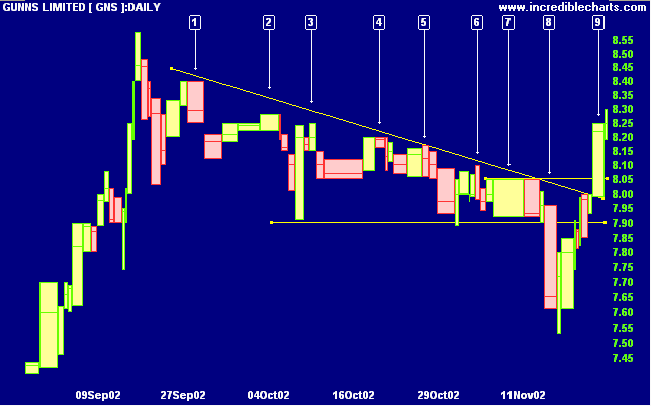
On the daily equivolume chart GNS has made a series of lower
highs, [1] to [7], in the form of a descending triangle. The
break below support at [8] was accompanied by reasonable
volume but the pull-back to [9] was far stronger than
expected, breaking above resistance at 7.90 and at 8.05. The
high from [7] is, significantly, also the high from [A] on
the weekly chart above.
This could well be a bear trap. A correction that fails to break below 8.05 will be a strong bull signal.
This could well be a bear trap. A correction that fails to break below 8.05 will be a strong bull signal.
A fall below 7.90 would be bearish.
Short-term: Long: The Slow Stochastic and MACD are above
their respective signal lines. Use tight stops.
Medium-term: Long. Use stop losses to protect yourself
against a sudden reversal.
Long-term: Wait for confirmation of the
bottom reversal signal.
Colin Twiggs
It is not important to do everything right
It is important to do the right things right.
- Peter Drucker
It is important to do the right things right.
- Peter Drucker
Back Issues
Click here to access the
Trading Diary Archives.
Back Issues
Access the Trading Diary Archives.