Chart Forum: Email
To contact another member, click on their link in the left margin. In the Profile page you will find:
Trading Diary
November 25, 2002
These extracts from my daily trading diary are intended to
illustrate the techniques used in short-term trading and should
not be interpreted as investment advice. Full terms and
conditions can be found at Terms
of Use .
USA
The Dow formed an inside day, closing up 0.5% at
8849 on lower volume.
The primary trend will reverse (up) if the index rises above 9130.
The Nasdaq Composite Index held on to its gains, closing up 0.9% at 1481.
The primary trend is up.
The S&P 500 an inside day, closing 2 points up at 932.
The primary trend will complete a double bottom reversal if it rises above 965.
The Chartcraft NYSE Bullish % Indicator signals a bull alert at 46% (November 22).
News Corporation
Newscorp may make a second attempt to take over DirecTV after EchoStar's bid encounters difficulties.
Gold
New York: Spot gold is down 290 cents at $US 317.70.
Newscorp may make a second attempt to take over DirecTV after EchoStar's bid encounters difficulties.
Gold
New York: Spot gold is down 290 cents at $US 317.70.
ASX Australia
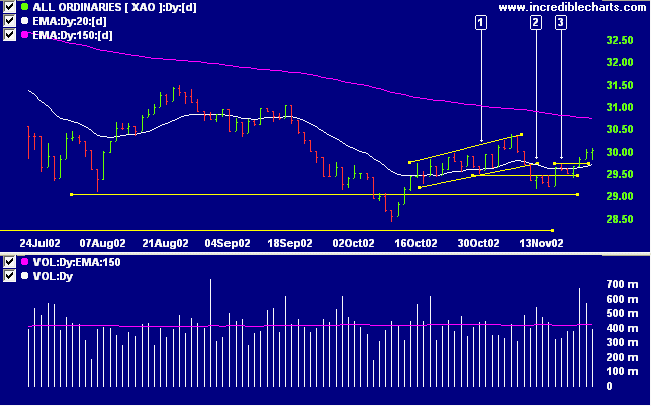
After an early 20-point fall, the All Ordinaries clawed its way
back to close 6 points up at 3005 on lower volume.
The primary trend will reverse if the index rises above 3150.
The MACD (26,12,9) and Slow Stochastic (20,3,3) are above their signal lines; Twiggs money flow signals accumulation.
The primary trend will reverse if the index rises above 3150.
The MACD (26,12,9) and Slow Stochastic (20,3,3) are above their signal lines; Twiggs money flow signals accumulation.
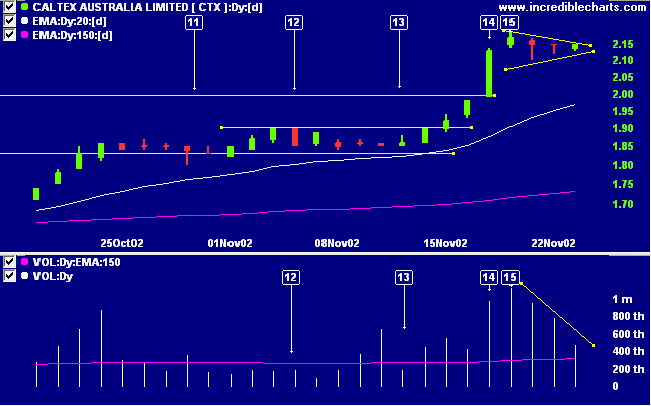
Caltex Australia [CTX]
Last covered on November 19, 2002.
After breaking through resistance at 2.00, CTX has failed to pull back to the support level, forming a bullish pennant pattern instead. The continuation pattern is reinforced by the sharp increase in volume, [14] and [15], at the start of the pattern, followed by declining volume. An upward breakout accompanied by a sharp increase in volume will be a strong bull signal. Stop losses are normally placed below the lower border of the pattern, opposite the breakout.
Relative strength (price ratio: xao), Twiggs money flow and MACD are all bullish.
Back Issues
Last covered on November 19, 2002.
After breaking through resistance at 2.00, CTX has failed to pull back to the support level, forming a bullish pennant pattern instead. The continuation pattern is reinforced by the sharp increase in volume, [14] and [15], at the start of the pattern, followed by declining volume. An upward breakout accompanied by a sharp increase in volume will be a strong bull signal. Stop losses are normally placed below the lower border of the pattern, opposite the breakout.
Relative strength (price ratio: xao), Twiggs money flow and MACD are all bullish.
The targeted move for an upward breakout is 2.44 (2.15 + 2.19
- 1.90), projected from the point of breakout.
A break below the lower border of the pattern would be bearish.
A break below the lower border of the pattern would be bearish.
Short-term: Long: The Slow Stochastic and MACD are above
their respective signal lines.
Medium-term: Long. Use stop losses to protect yourself
against a sudden reversal.
Long-term: Wait for confirmation of the
bottom reversal signal.
Colin Twiggs
It took me over a decade to figure out my
natural direction.
I'd suggest that you take the time to seriously ponder
whether the path you are on is the one you want to be on.
Perhaps your journey will then be shortened.
- Jack Schwager's conclusion to The New Market Wizards
I'd suggest that you take the time to seriously ponder
whether the path you are on is the one you want to be on.
Perhaps your journey will then be shortened.
- Jack Schwager's conclusion to The New Market Wizards
Back Issues
Click here to access the
Trading Diary Archives.
Back Issues
Access the Trading Diary Archives.