Chart Forum: Market Professionals
We request that individuals employed in the broking, financial planning, investment management or share trading (including software and training) industry, disclose their interest when posting to the Chart Forum. Disclosure can be made in the Members Profile or on the actual posting. Failure to disclose will be viewed as a deliberate attempt to mislead members and will incur an advertising charge at penalty rates.
Our aim is to protect members from market professionals who recommend products or services, or talk up stocks, without disclosing their interest.
Trading Diary
November 19, 2002
These extracts from my daily trading diary are intended to
illustrate the techniques used in short-term trading and should
not be interpreted as investment advice. Full terms and
conditions can be found at Terms
of Use .
Understanding the Trading Diary provides further guidance.
USA
The Dow closed almost unchanged at 8474 on
higher volume. The recent pattern appears to be forming a head
and shoulders but there are two caveats: (1) volume decreased on
the last correction and showed some increase into the right
shoulder; (2) never trust a head and shoulders pattern with a
visibly ascending neckline. The pattern is unreliable. However, a
break below 8200 will signal a secondary cycle down-trend.
The primary trend will reverse (up) if the index rises above 9130.
The Nasdaq Composite Index retreated to 1374 after testing resistance at 1426, down 1.4%.
The primary trend will reverse (up) if the index breaks above 1426.
The S&P 500 threatens a similar head and shoulders pattern to the Dow, closing 4 points down at 896.
The primary trend will complete a double bottom reversal if it rises above 965.
The Chartcraft NYSE Bullish % Indicator signals a bull alert at 42% (November 18).
When the going gets tough, the tough go
shopping
Warren Buffett may bid for Burger King. (more)
Gold
New York: Spot gold is down 80 cents at $US 318.40.
Warren Buffett may bid for Burger King. (more)
Gold
New York: Spot gold is down 80 cents at $US 318.40.
ASX Australia
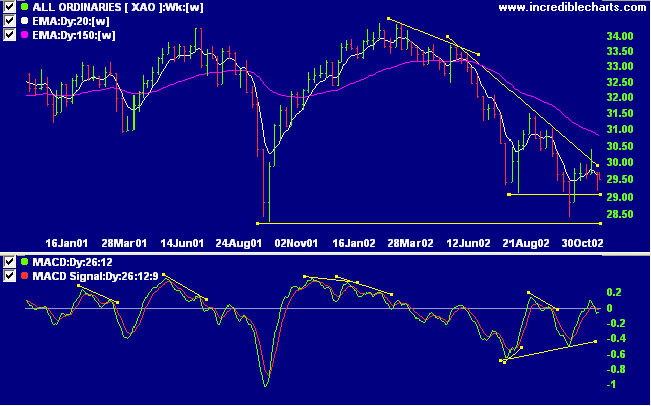
The All Ordinaries lost a further 10 points to close at 2951 on
higher volume.
The primary trend will reverse if the index rises above 3150.
The Slow Stochastic (20,3,3) is above its signal line, MACD (26,12,9) is below, while Twiggs money flow signals distribution.
The primary trend will reverse if the index rises above 3150.
The Slow Stochastic (20,3,3) is above its signal line, MACD (26,12,9) is below, while Twiggs money flow signals distribution.
Divergences on the MACD indicator are one of the most reliable
signals in technical analysis. I have highlighted them with
yellow trendlines on the MACD indicator. Another strong MACD
signal is a crossover after an MACD spike, as in September
2001.
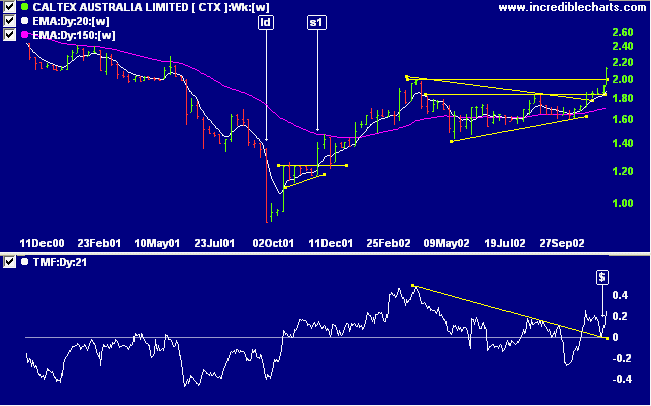
Caltex Australia [CTX]
Last covered on October 24.
CTX has broken above its 2002 high of 2.00 with a strong spike day. Relative strength (price ratio: xao) is rising sharply and Twiggs money flow signals accumulation after a strong bull signal: where TMF formed a trough above zero. MACD is similarly bullish.
Last covered on October 24.
CTX has broken above its 2002 high of 2.00 with a strong spike day. Relative strength (price ratio: xao) is rising sharply and Twiggs money flow signals accumulation after a strong bull signal: where TMF formed a trough above zero. MACD is similarly bullish.
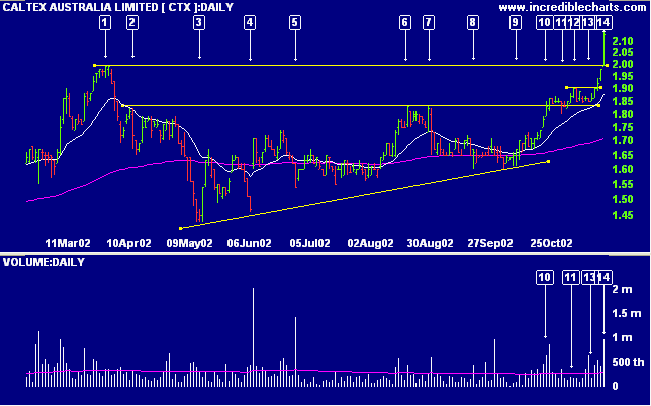
The breakout above 2.00 resistance occurred at [14] on strong
volume. The spike day means that it will be risky to enter
above the close because reasonable stop positions are too
wide. The ideal entry point was at [11] when the range and
volume had dried up before the next rally at [12]. Higher
volume at [13] signaled accumulation and was quickly followed
by a strong rally to [14], with a further buy opportunity
just above 2.00. Stop losses should be placed below the low
at [11] and then moved up to below the low of [13].
The next conservative entry point will be if CTX pulls back
to test support at 2.00. Entry should be made if price breaks
above the high of the lowest day, in a pull-back of short
duration, with stops placed below the low of the lowest
day.
A pull-back below 1.90 would be bearish.
Back Issues
A pull-back below 1.90 would be bearish.
Short-term: Avoid new entries: The Slow Stochastic and MACD
are on opposite sides of their respective signal lines.
Medium-term: Avoid new entries. Use stop losses to protect
yourself against a sudden reversal.
Long-term: Wait for confirmation of the
bottom reversal signal.
Colin Twiggs
Destiny is not a matter of chance;
it is a matter of choice.
It is not a thing to be waited for;
it is a thing to be achieved.
- William Jennings Bryan
it is a matter of choice.
It is not a thing to be waited for;
it is a thing to be achieved.
- William Jennings Bryan
Back Issues
Click here to access the
Trading Diary Archives.
Back Issues
Access the Trading Diary Archives.