Understanding the Trading Diary
Trading Diary
November 15, 2002
These extracts from my daily trading diary are
intended to illustrate the techniques used in short-term trading
and should not be interpreted as investment advice. Full terms
and conditions can be found at Terms
of Use .
Understanding the Trading Diary provides further guidance.
USA
The Dow encountered resistance at 8600, closing
up 0.4% at 8579 higher volume.
The primary trend will reverse (up) if the index rises above 9130.
The Nasdaq Composite Index formed another equal top, closing unchanged at 1411.
The primary trend will reverse (up) if the index breaks above 1426.
The S&P 500 closed up 5 points at 909.
The primary trend will complete a double bottom reversal if it rises above 965.
The Chartcraft NYSE Bullish % Indicator signals a bull alert at 40% (November 14).
Techs cautious
Tech stocks struggled as Dell cautions that the outlook is unclear; Merrill Lynch downgrades Intel; and Gateway announces it is under investigation by the SEC. (more)
Gold
New York: Spot gold is up 250 cents at $US 320.30.
Tech stocks struggled as Dell cautions that the outlook is unclear; Merrill Lynch downgrades Intel; and Gateway announces it is under investigation by the SEC. (more)
Gold
New York: Spot gold is up 250 cents at $US 320.30.
ASX Australia
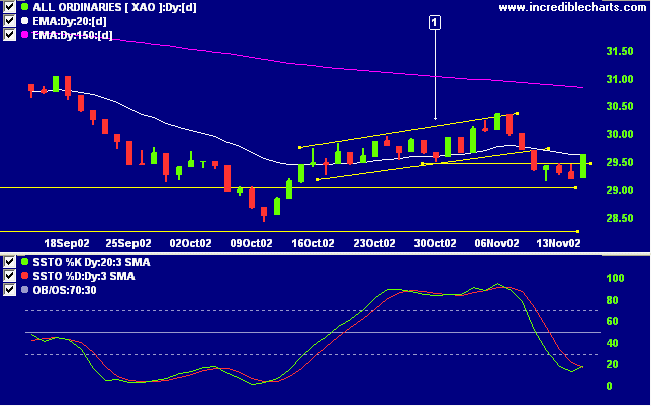
The All Ordinaries gained 43 points to close at 2965 but on low
volume. Positive news from the US carried the market above the
previous low at [1].
The primary trend will reverse if the index rises above 3150.
The Slow Stochastic (20,3,3) crossed above its signal line, MACD (26,12,9) is below, while Twiggs money flow signals distribution.
The primary trend will reverse if the index rises above 3150.
The Slow Stochastic (20,3,3) crossed above its signal line, MACD (26,12,9) is below, while Twiggs money flow signals distribution.
Macquarie Bank [MBL]
Last covered on July 25.
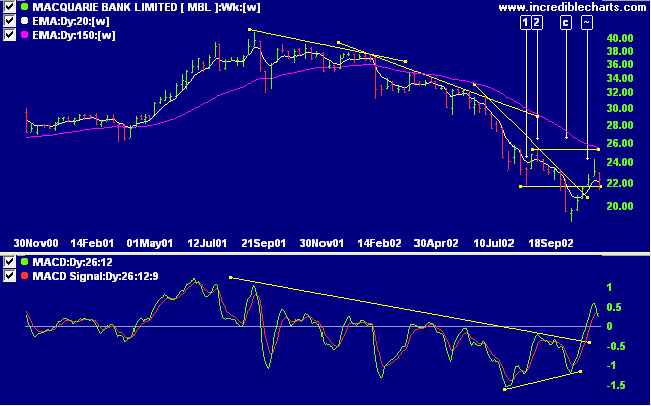
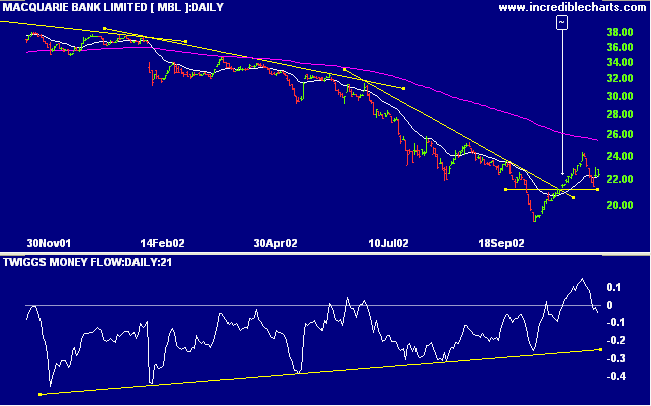
MBL experienced a stage 4 down-trend over the last year, accelerating into capitulation at [c]. Price subsequently recovered above the low of [1], at [~], signaling that the down-trend is weakening. MACD broke above the downward trend line after a bullish divergence.
Last covered on July 25.
MBL experienced a stage 4 down-trend over the last year, accelerating into capitulation at [c]. Price subsequently recovered above the low of [1], at [~], signaling that the down-trend is weakening. MACD broke above the downward trend line after a bullish divergence.
Twiggs money flow still signals distribution but shows a
longer term bullish divergence. Relative strength (price
ratio:xao) appears to be bottoming.
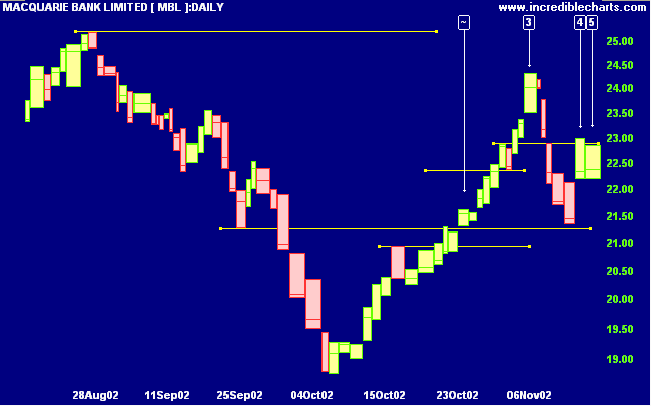
The Equivolume chart shows the recent rally expiring at [3],
with strong volume and a long shadow signaling resistance.
The next rally at [4] and [5] shows broad volume and long
shadows, signaling selling pressure. MBL is likely to build a
base and re-test October lows before entering an up-trend.
This may take several months.
Back Issues
Sector Analysis
Changes are highlighted in bold.
Changes are highlighted in bold.
- Energy [XEJ] - stage 4 (RS is falling)
- Materials [XMJ] - stage 1 (RS is rising)
- Industrials [XNJ] - stage 4 (RS is falling)
- Consumer Discretionary [XDJ] - stage 1 (RS is rising)
- Consumer Staples [XSJ] - stage 1 (RS is level)
- Health Care [XHJ] - stage 4 (RS is falling)
- Property Trusts [XPJ] - stage 3 (RS is rising)
- Financial excl. Property Trusts [XXJ] - stage 4 (RS is falling)
- Information Technology [XIJ] - stage 4 (RS is falling)
- Telecom Services [XTJ] - stage 4 (RS is falling)
- Utilities [XUJ] - stage 2 (RS is rising)
Sectors: Relative Strength
A stock screen of the ASX 200 using % Price Move (1 month: +5%) returned 27 stocks (compared to 99, August 23rd and 10 on October 4th). Notable sectors are:
A stock screen of the ASX 200 using % Price Move (1 month: +5%) returned 27 stocks (compared to 99, August 23rd and 10 on October 4th). Notable sectors are:
- Diversified Metals & Mining
Short-term: Avoid new entries: The Slow Stochastic and MACD
are on opposite sides of their respective signal lines.
Medium-term: Avoid new entries. Use stop losses to protect
yourself against a sudden reversal.
Long-term: Wait for confirmation of the
bottom reversal signal.
Colin Twiggs
Recognize our single purpose when the market opens each
morning.
We are there to take other people's money before they take ours.
- Alan S. Farley, The Master Swing Trader
We are there to take other people's money before they take ours.
- Alan S. Farley, The Master Swing Trader
Back Issues
Click here to access the
Trading Diary Archives.
Back Issues
Access the Trading Diary Archives.