Understanding the Trading Diary
Trading Diary
November 13, 2002
These extracts from my daily trading diary are
intended to illustrate the techniques used in short-term trading
and should not be interpreted as investment advice. Full terms
and conditions can be found at Terms
of Use .
USA
The Dow formed another inside day, with sellers struggling to
move the market. The average closed at 8398 on higher volume. The
primary trend will reverse (up) if the index rises above
9130.
The Nasdaq Composite Index gained 0.9%% to close at 1361. The primary trend will reverse (up) if the index breaks above 1426.
The S&P 500 closed unchanged at 882. The primary trend will complete a double bottom reversal if it rises above 965.
The Chartcraft NYSE Bullish % Indicator signals a bull alert at 40% (November 12).
Iraq concedes
Iraq agrees to the return of UN weapons inspectors but the US and Britain are skeptical. (more)
Gold
New York: Spot gold dropped sharply on the news from the UN and is down 510 cents at $US 318.80.
Iraq agrees to the return of UN weapons inspectors but the US and Britain are skeptical. (more)
Gold
New York: Spot gold dropped sharply on the news from the UN and is down 510 cents at $US 318.80.
ASX Australia
The All Ordinaries eased to close 11 points down at 2943 on
lower volume. Sellers are in control. The primary trend will
reverse if the index rises above 3150.
The MACD (26,12,9) and Slow Stochastic (20,3,3) are below their signal lines, while Twiggs money flow has given a bearish signal [-], reversing below zero.
The MACD (26,12,9) and Slow Stochastic (20,3,3) are below their signal lines, while Twiggs money flow has given a bearish signal [-], reversing below zero.
Gold
Last covered on September 11.
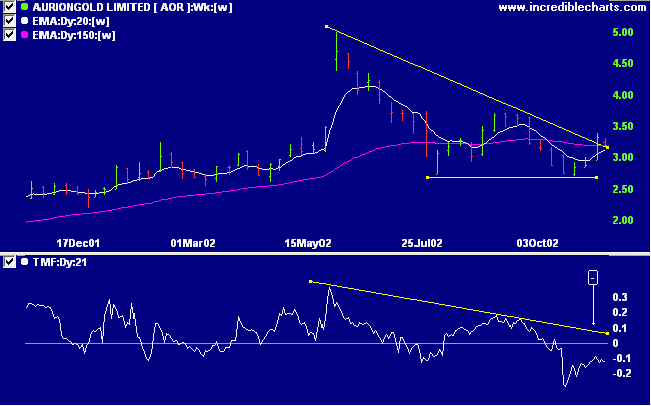
Several gold stocks have formed bearish patterns on the weekly charts.
AOR has formed a descending triangle. The upward break in the last two weeks appears to be a false break: Twiggs money flow signals distribution and displays a bearish peak below the zero line. Relative strength (price ratio: xao) is falling and MACD is bearish.
Back Issues
Last covered on September 11.
Several gold stocks have formed bearish patterns on the weekly charts.
AOR has formed a descending triangle. The upward break in the last two weeks appears to be a false break: Twiggs money flow signals distribution and displays a bearish peak below the zero line. Relative strength (price ratio: xao) is falling and MACD is bearish.
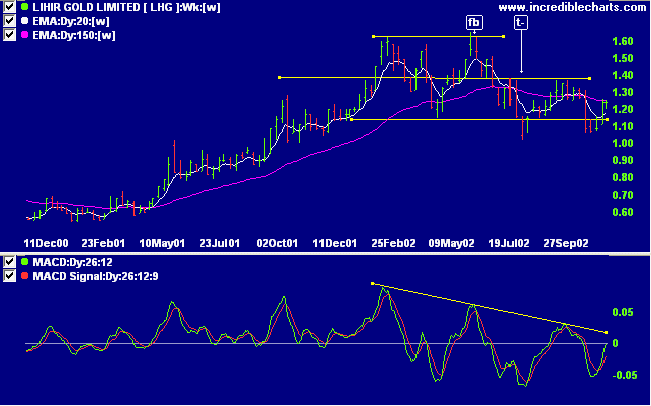
After a bearish MACD divergence, Lihir Gold Limited [LHG]
completed a false break at [fb] followed by a double top
reversal at [t-]. The stock has since formed equal lows in
July and October - not a strong signal in a down-trend.
Relative strength (price ratio: xao) is falling and Twiggs
money flow shows a bearish divergence. A fall below 1.06 will
confirm the continuation of the down-trend, while a rise
above 1.37 would be bullish.
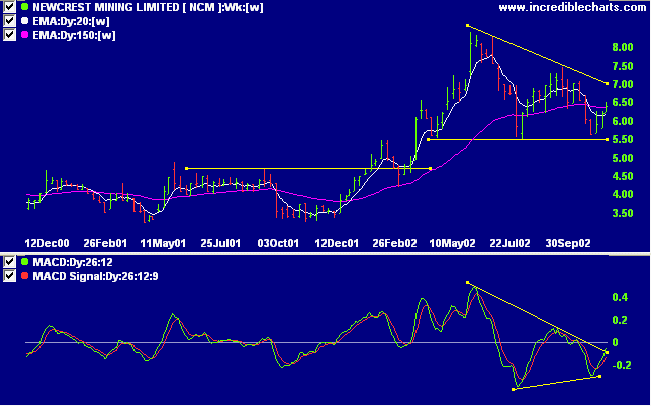
Newcrest Mining [NCM] has also formed a descending triangle.
Relative strength (price ratio:xao) is falling and MACD is
bearish.
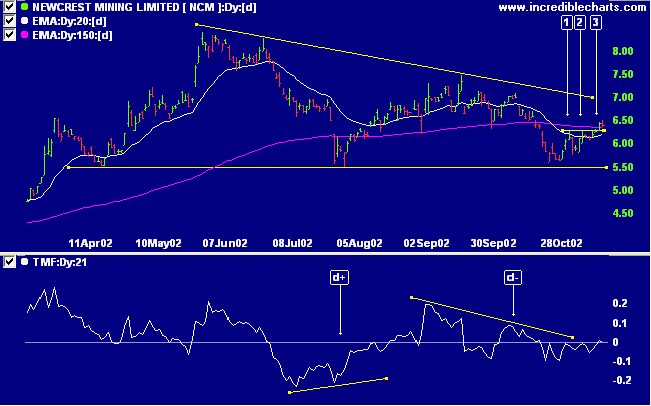
Twiggs money flow signals a bearish divergence at [d-]. In
the short-term, equal highs have formed at [1] and [2]
followed by a breakout at [3] completing a small ascending
triangle. The target is 6.82 (6.26 + 6.26 - 5.70), below the
upper border of the larger descending triangle. This sort of
trade should only be attempted by the most intrepid
short-term traders as the long-term pattern is bearish.
A fall below 5.50 will be a strong bear signal.
A fall below 5.50 will be a strong bear signal.
Short-term: Short if there is a break below support at 2909:
The Slow Stochastic and MACD are below their respective
signal lines.
Medium-term: Avoid new entries. Use stop losses to protect
yourself against a sudden reversal.
Long-term: Wait for confirmation of the
bottom reversal signal.
Colin Twiggs
I know millions of things that won't
work.
I've certainly learned a lot.
- Thomas A. Edison
I've certainly learned a lot.
- Thomas A. Edison
Back Issues
Click here to access the
Trading Diary Archives.
Back Issues
Access the Trading Diary Archives.