Incredible Charts 4.0.0.8
The new version will be released within the next few days.
Trading Diary
November 06, 2002
These extracts from my daily trading diary are
intended to illustrate the techniques used in short-term trading
and should not be interpreted as investment advice. Full terms
and conditions can be found at Terms
of Use .
USA
After a brief dip in the afternoon the Dow
rallied to close up 1% at 8771 on higher volume, continuing the
secondary rally. The primary trend will reverse if the index
rises above 9130.
The Nasdaq Composite Index closed up 1.2% at 1418, threatening a primary trend reversal if the index breaks above 1426.
The S&P 500 gained 8 points to close at 923. The primary trend is down, but the index will complete a double bottom reversal if it rises above 965.
The Chartcraft NYSE Bullish % Indicator signals a bull alert at 40% (November 05).
Back Issues
The Nasdaq Composite Index closed up 1.2% at 1418, threatening a primary trend reversal if the index breaks above 1426.
The S&P 500 gained 8 points to close at 923. The primary trend is down, but the index will complete a double bottom reversal if it rises above 965.
The Chartcraft NYSE Bullish % Indicator signals a bull alert at 40% (November 05).
The Fed cuts overnight lending
rate
The Federal Reserve Board surprised the market with a half-percent rate cut to a 40-year low of 1.25%. (more)
Gold
New York: Spot gold is up 70 cents at $US 317.80.
The Federal Reserve Board surprised the market with a half-percent rate cut to a 40-year low of 1.25%. (more)
Gold
New York: Spot gold is up 70 cents at $US 317.80.
ASX Australia
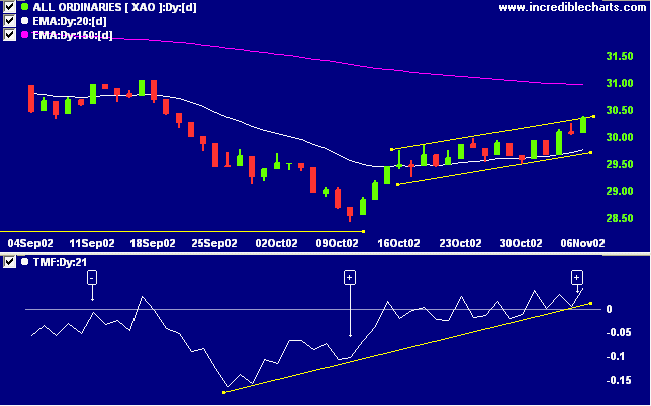
The All Ordinaries closed up 28 points at 3036 on higher
volume, threatening to break above the bullish flag pattern.
The primary trend will reverse if the index rises above
3150.
The Slow Stochastic (20,3,3) and MACD (26,12,9) are above their signal lines, while Twiggs money flow signals accumulation.
The Slow Stochastic (20,3,3) and MACD (26,12,9) are above their signal lines, while Twiggs money flow signals accumulation.
AJ Lucas [AJL]
Last covered on November 5th.
The market was kind and didn't take out the tight stop, it rallied straight from the opening.
Last covered on November 5th.
The market was kind and didn't take out the tight stop, it rallied straight from the opening.
Sonic Healthcare [SHL]
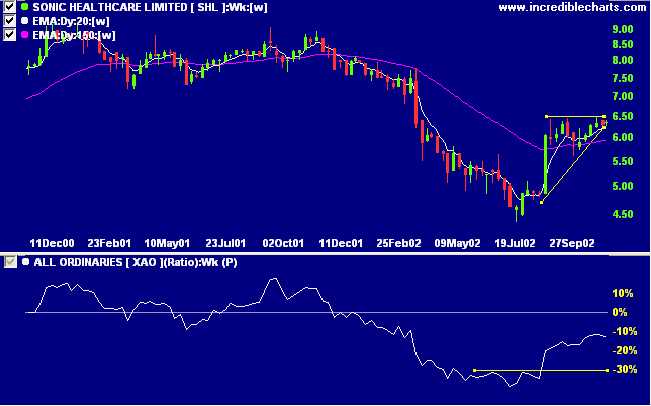
Last covered on July 11th.
After a stage 4 down-trend, SHL rallied sharply off its low before consolidating with three equal highs, forming a bullish ascending triangle pattern. Relative strength (price ratio: xao) is rising.
Last covered on July 11th.
After a stage 4 down-trend, SHL rallied sharply off its low before consolidating with three equal highs, forming a bullish ascending triangle pattern. Relative strength (price ratio: xao) is rising.
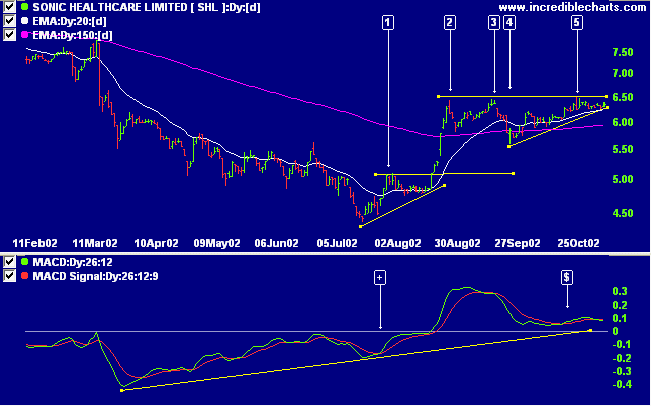
On the daily chart you can see how SHL rallied off its low,
breaking above the high at [1] before forming two equal highs
at [2] and [3]. The subsequent correction at [4] broke below
the previous low but left a healthy space above the high of
[1], signaling that the trend was still intact. The rally to
[5] formed a third equal high before a weak pull-back revealed
increased buying interest. MACD signaled a bullish divergence
at [+] followed by further confirmation at [$], where it
respected the zero line. Twiggs money flow signals
accumulation.
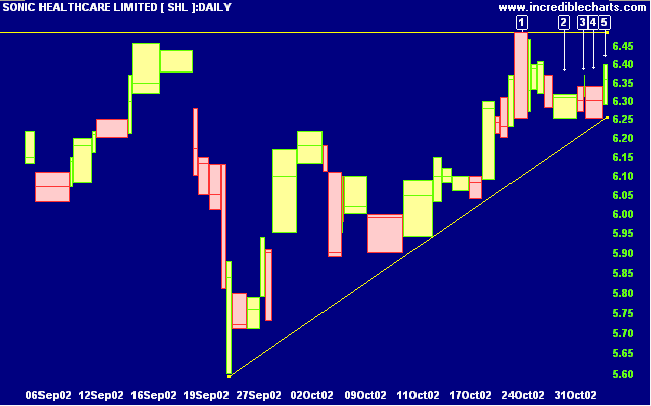
The rally at [1] on the equivolume chart finished with a weak
close, equal to the daily low. This was followed by 3 days of
uncertainty: two inside days and an outside day; before a
test of the low from day [1]. Buying support was evident from
the thicker bar on day [2], signaling support at 6.25. The
two-day rally to [3] was weak and followed by a pull-back to
the support level at [4]. Some options traders may have
already jumped in at around the 6.35 mark when the stock
rallied above the low of day [2], with stops below 6.25.
Volume still appears a bit sluggish at [5] and I am inclined
to wait for a stronger signal.
A break above the upper border of the triangle at 6.50 will be a bullish signal, while a fall below 6.25 would be bearish.
A break above the upper border of the triangle at 6.50 will be a bullish signal, while a fall below 6.25 would be bearish.
Short-term: Take new entries where stops are tight. The Slow
Stochastic and MACD are above their respective signal lines,
but the Stochastic is in oversold territory.
Medium-term: Take new entries. Use stop losses to protect
yourself against a sudden reversal.
Long-term: Wait for confirmation of the
bottom reversal signal.
Colin Twiggs
Thought for the Day:
Still on a military theme:
The Duke of Wellington once likened the campaigns of Napoleon's generals to a fine work of lace, to be admired for their detail, precision and symmetry; whereas he compared his own to a piece of rope: if cut, you could simply tie a knot and keep going.
The same applies to trading strategies.
Back Issues
Click here to access the
Trading Diary Archives.
Back Issues
Access the Trading Diary Archives.