Incredible Charts version 4.0.0.8
The next version of Incredible Charts will enable users to screen their own watchlists.
Trading Diary
October 31, 2002
These extracts from my daily trading diary are
intended to illustrate the techniques used in short-term trading
and should not be interpreted as investment advice. Full terms
and conditions can be found at Terms
of Use .
USA
The Dow formed an inside day, closing up
slightly at 8397 on average volume. The market is ranging,
signaling uncertainty. A break above 8600 will be bullish and
below 8160 bearish. A primary trend reversal will be signaled if
the index rises above 9130.
The Nasdaq Composite Index tested upper resistance before closing back at 1329. The primary trend will reverse if the index breaks above 1426.
The S&P 500 is also ranging, closing 5 points down at 885. The primary trend is down. The index will complete a double bottom reversal if it rises above 965.
The Chartcraft NYSE Bullish % Indicator signals a bull alert at 36% (October 30).
GDP growth
The US Commerce department report that GDP has grown by an annualized 3.1% in the third-quarter, compared to 1.3% in the last quarter, but lower than the expected 3.6%. (more)
The US Commerce department report that GDP has grown by an annualized 3.1% in the third-quarter, compared to 1.3% in the last quarter, but lower than the expected 3.6%. (more)
Midwest manufacturing contracts
The Chicago division of National Association of Purchasing Management index fell to 45.9 from 48.1 last month.
Back Issues
The Chicago division of National Association of Purchasing Management index fell to 45.9 from 48.1 last month.
Gold
New York: Spot gold was up 200 cents at $US 317.90.
New York: Spot gold was up 200 cents at $US 317.90.
ASX Australia
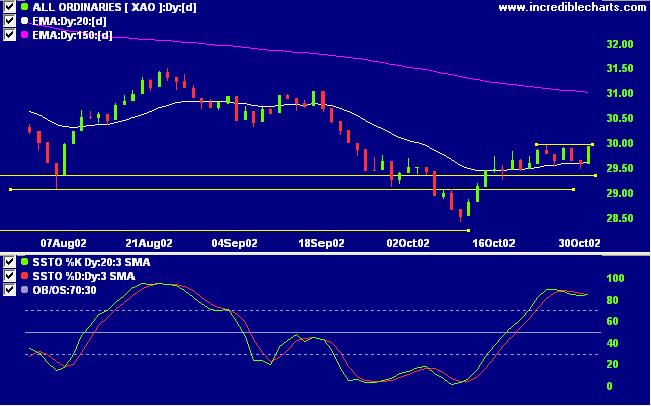
The All Ordinaries rallied to close just below the 3000
resistance level, at 2995 on average volume. The index is
ranging, signaling uncertainty. The primary trend will
reverse if the index rises above 3150.
The Slow Stochastic (20,3,3) has crossed back above its signal line, MACD is above, while Twiggs money whipsaws around the zero line.
The Slow Stochastic (20,3,3) has crossed back above its signal line, MACD is above, while Twiggs money whipsaws around the zero line.
Southcorp [SRP]
Last covered on August 20, 2002.
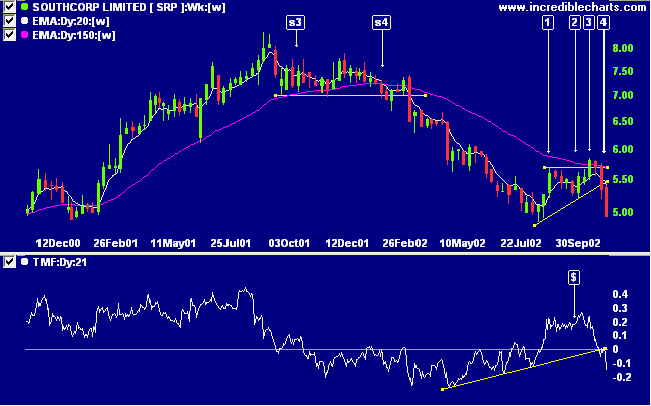
Here is a pattern worth storing in the memory for future reference. After a lengthy stage 4 down-trend SRP rallied to form a bullish ascending triangle pattern, completed by a breakout at [3]. This quickly reversed into a bull trap with a break below the base of the triangle. Twiggs money flow, after initial bull signals, has fallen sharply to signal distribution.
Jack Schwager maintains that failed signals are "among the most reliable of all chart signals" (Schwager on Futures: Technical Analysis).
Last covered on August 20, 2002.
Here is a pattern worth storing in the memory for future reference. After a lengthy stage 4 down-trend SRP rallied to form a bullish ascending triangle pattern, completed by a breakout at [3]. This quickly reversed into a bull trap with a break below the base of the triangle. Twiggs money flow, after initial bull signals, has fallen sharply to signal distribution.
Jack Schwager maintains that failed signals are "among the most reliable of all chart signals" (Schwager on Futures: Technical Analysis).
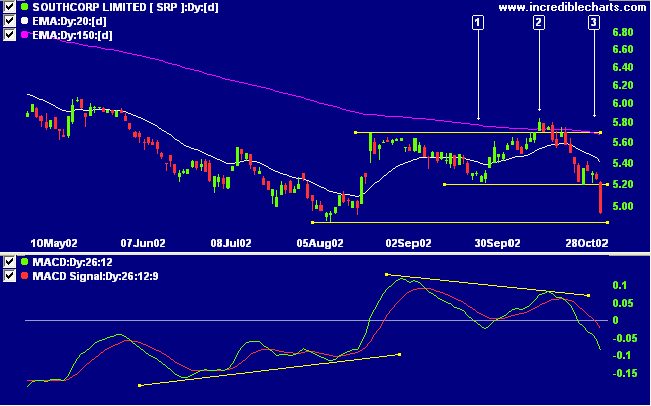
MACD initially signaled a bullish divergence, only to swing
to a bearish divergence shortly after the triangle pattern
was completed at [2]. The break below support at [3]
completed a bearish double top reversal.
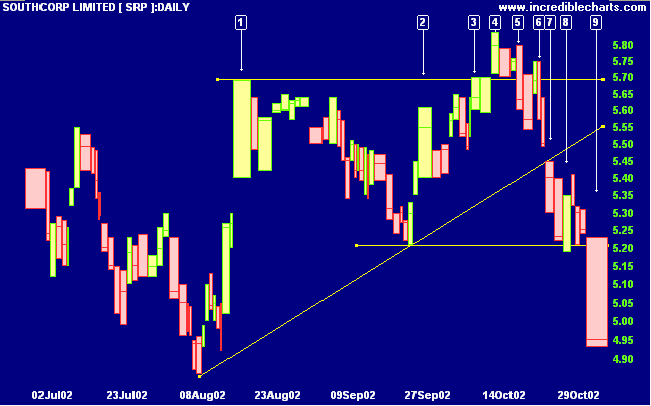
Equivolume shows a strong gap up at [1] followed by a
correction on weak volume before the rally at [2]. There was
decent volume at the breakout, from [3] to [4], but the
pull-back on the following day was stronger. The break below
support at [5] signaled that all was not going according to
plan. Another weak rally was followed by a fall below the
recent low, confirming that the breakout had failed. The
break below the base of the triangle at [7] alerts us to the
fact that buying support is failing. This is followed by a
brief attempt to rally above support at [8] before the plunge
at [9].
With the benefit of hindsight: a buy-stop would have been
placed above the high of [3] with a stop-loss at 5.45, below
the recent low. The stop-loss should be moved to just below
the support line after the bear signal on the second day of
the breakout. The position would then be stopped out at a
small loss at [5]. A sell-stop could be placed below the low
at [8] which would enter a short trade on day [9], with a
stop-loss above the recent high at 5.41.
Short-term: Take new entries with caution. The Slow
Stochastic is in oversold territory but has crossed back
above its signal line. MACD is above. Only take entries where
stops are tight.
Medium-term: Avoid new entries. Use stop losses to protect
yourself against a sudden reversal.
Long-term: Wait for confirmation of the
bottom reversal signal.
Colin Twiggs
Thought for the Day:
Many intelligence reports in war are contradictory; even more are false, and most are uncertain.
Claus von Clausewitz (1831), On War.
We now know how securities analysts were employed in the 19th century.
Many intelligence reports in war are contradictory; even more are false, and most are uncertain.
Claus von Clausewitz (1831), On War.
We now know how securities analysts were employed in the 19th century.
Back Issues
Click here to access the
Trading Diary Archives.
Back Issues
Access the Trading Diary Archives.