Stock Screens
Some development work is being done in this area and today users may experience the temporary loss of one or two filters.
Trading Diary
October 28, 2002
These extracts from my daily trading diary are
intended to illustrate the techniques used in short-term trading
and should not be interpreted as investment advice. Full terms
and conditions can be found at Terms
of Use .
USA
The Dow closed 0.9% down at 8368 on higher
volume. The market is moving sideways, signaling uncertainty.
Contracting volume on up-days and expanding volume on down-days
is a bearish sign. A primary trend reversal will be signaled if
the index rises above 9130.
The Nasdaq Composite Index lost 16 points to close at 1315. The primary trend will reverse if there is a break above 1426.
The S&P 500 eased 7 points to close at 890. The primary trend is down. The index will complete a double bottom reversal if it rises above 965.
The Chartcraft NYSE Bullish % Indicator has swung to a bull alert signal at 36% (October 25).
US Dollar falls against Euro and
Yen
Concerns that the US recovery is faltering may convince the Fed to lower interest rates. (more)
Gold
New York: Spot gold is up 220 cents at $US 315.30. The gold chart has been forming a bullish ascending triangle over the last 6 months.
Concerns that the US recovery is faltering may convince the Fed to lower interest rates. (more)
Gold
New York: Spot gold is up 220 cents at $US 315.30. The gold chart has been forming a bullish ascending triangle over the last 6 months.
ASX Australia
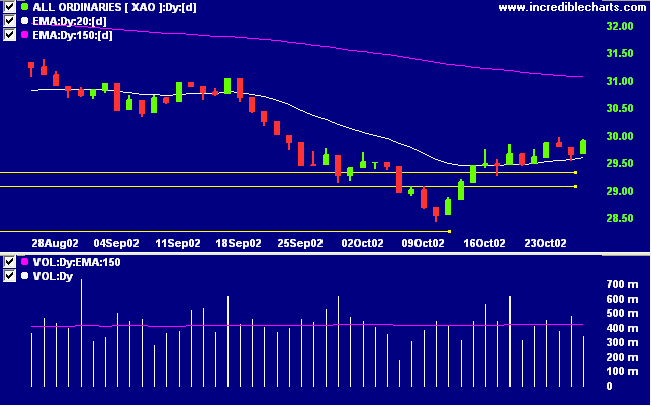
The All Ordinaries gained 23 points to close at 2990 on low
volume. The index is still moving sideways, signaling
uncertainty. A rise above 3150 will signal a primary trend
reversal.
The Slow Stochastic (20,3,3) has crossed to below its signal line. MACD is above, while Twiggs money whipsaws around the zero line.
The Slow Stochastic (20,3,3) has crossed to below its signal line. MACD is above, while Twiggs money whipsaws around the zero line.
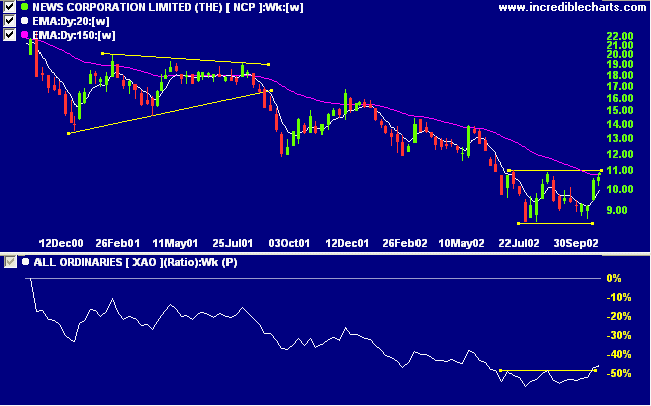
News Corporation [NCP]
After a stage 4 down-trend NCP has formed 2 equal bottoms in the past 6 months. Relative strength (price ratio: xao) has signaled a trend change with a higher trough and break above the last peak.
After a stage 4 down-trend NCP has formed 2 equal bottoms in the past 6 months. Relative strength (price ratio: xao) has signaled a trend change with a higher trough and break above the last peak.
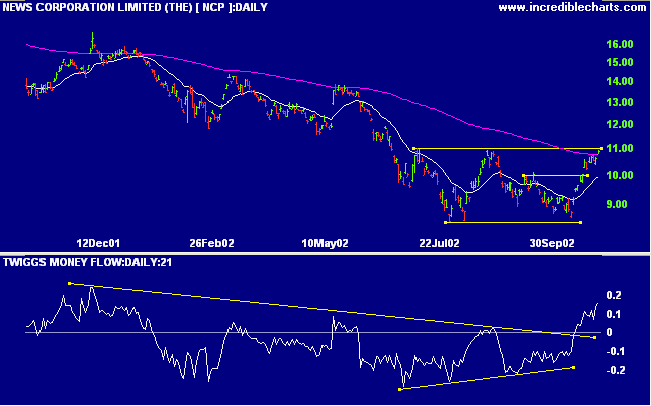
NCP appears close to completing a double bottom reversal pattern,
with price just below resistance at 11.00. Twiggs money flow has
broken the downward trendline after a bullish divergence and now
signals accumulation. MACD also shows a bullish divergence.
The equivolume chart shows strong volume on the rally before [3]
and a bullish congestion pattern below the resistance line, at
[3]. A break above 10.92, the high at
[2], will be bullish, but a rise above 11.00 will be more
convincing, especially if accompanied by increased volume.
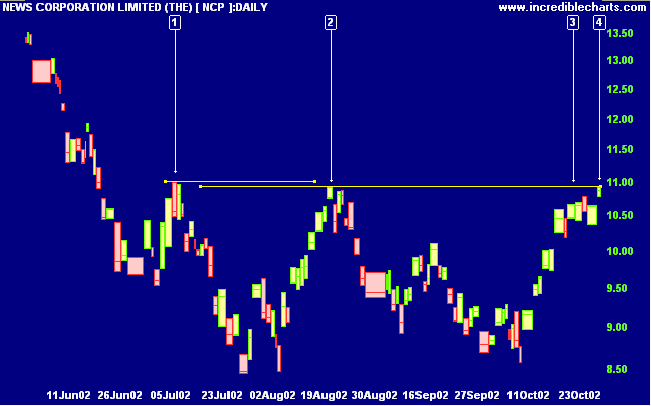
The targeted move for a breakout is 13.34 (10.92 + 10.92 - 8.50).
Short-term: Avoid new entries. The Slow Stochastic and MACD are
above their respective signal lines.
Medium-term: Avoid new entries. Use stop losses to protect
yourself against a sudden reversal.
Long-term: Wait for confirmation of the
bottom reversal signal.
Colin Twiggs
Thought for the
Day:
Action without thought is like shooting without aim
- Old proverb.
Action without thought is like shooting without aim
- Old proverb.
Back Issues
Click here to access the
Trading Diary Archives.
Back Issues
Access the Trading Diary Archives.