Suggestions
Thank you for the many useful suggestions. They help us to plan further development.
If you have suggestions as to how we can
improve the charts, website or newsletter,
please post them at the Chart
Forum: Suggestion Box.
Trading Diary
October 17, 2002
These extracts from my daily trading diary are
intended to illustrate the techniques used in short-term trading
and should not be interpreted as investment advice. Full terms
and conditions can be found at Terms
of Use .
USA
The Dow held above the 8000 level, closing up almost 3% at 8275
on strong volume. The Dow Theory will signal a primary trend
reversal if the index rises above 9130.
The Nasdaq Composite Index gained more than 3% to close at 1272. The primary trend will reverse if there is a break above 1426.
The S&P 500 gained 19 points to close at 879. The index will complete a double bottom if it rises above 965. The primary trend is down.
The Chartcraft NYSE Bullish % Indicator reflects a bear confirmed signal at 26% (October 16).
Microsoft up
Microsoft reports first-quarter earnings of 50 cents per share, beating analysts estimates, but lowers forecasts for the next quarter. (more)
Back Issues
Microsoft reports first-quarter earnings of 50 cents per share, beating analysts estimates, but lowers forecasts for the next quarter. (more)
Gold
New York: Spot gold last traded at $US 311.60, down 270 cents.
New York: Spot gold last traded at $US 311.60, down 270 cents.
ASX Australia
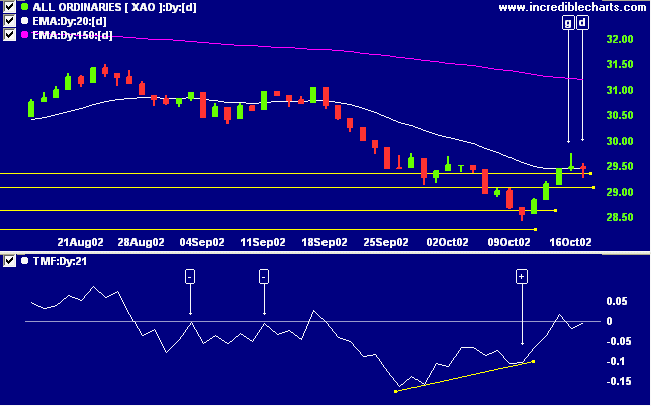
The All Ordinaries formed a dragonfly doji candlestick
[d], signaling that buyers are back in control. The index
closed 2 points down on above-average volume, holding above
support at 2910. A break above 3150 will signal a primary trend
reversal.
MACD (26,12,9) and Slow Stochastic (20,3,3) are above their signal lines. Twiggs money flow is rising, after a bullish divergence [+].
MACD (26,12,9) and Slow Stochastic (20,3,3) are above their signal lines. Twiggs money flow is rising, after a bullish divergence [+].
Adelaide Brighton Cement [ABC]
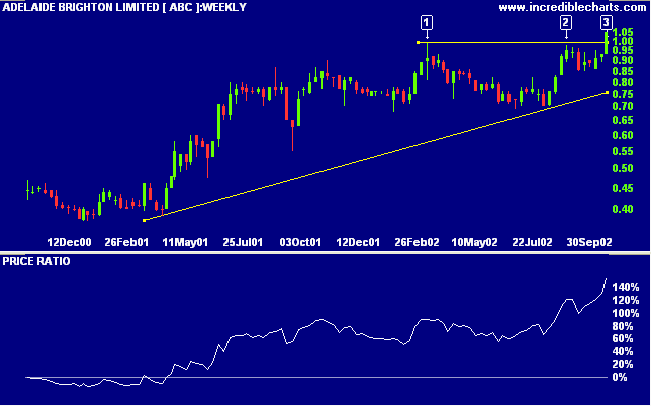
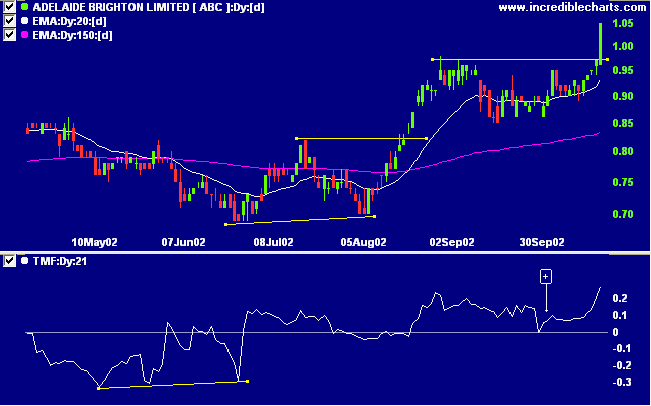
ABC entered a period of consolidation, below 1.00, after starting a stage 2 up-trend. Relative strength (price ratio: xao) is rising. A bullish cup and handle pattern can be seen, with the cup from [1] to [2] and the handle at [2] to [3].
ABC entered a period of consolidation, below 1.00, after starting a stage 2 up-trend. Relative strength (price ratio: xao) is rising. A bullish cup and handle pattern can be seen, with the cup from [1] to [2] and the handle at [2] to [3].
Twiggs money flow and MACD show bullish divergences, with TMF
respecting the zero line at [+], signaling strong accumulation.
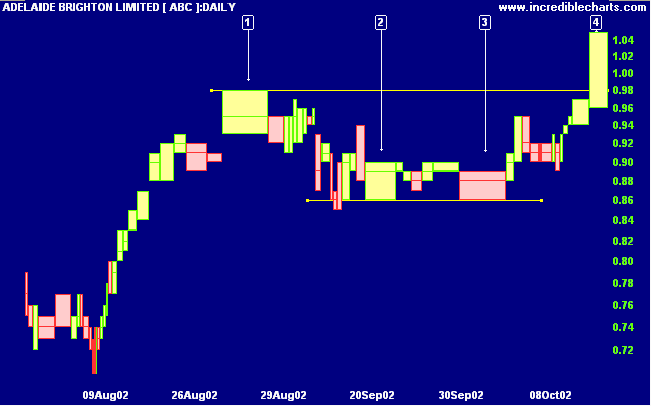
The equivolume chart reflects the handle from the cup
and handle pattern. At [1] higher prices were rejected with
the broad bar showing increased volume and the long upper
shadow signaling that sellers had wrested control away from
buyers. [2] and [3] reflect strong buying support at 0.86. The
breakout at [4] is confirmed by strong volume. The ideal entry
point would have been a buy-stop at 1.01 or 1.02 (avoid round
numbers) with a stop-loss either at: (1) 0.88 below the recent
low; (2) 0.92 below the 20-day MA; or (3) 0.97 below the
support/resistance line; depending on the trading objective and
time frame.
Hopefully ABC will pull back to test the 0.98 support level,
giving a second bull signal when it rallies off its lows.
Short-term: Long. The Slow Stochastic
and MACD are above their respective signal lines.
Medium-term: Long. Use stop losses to
protect yourself against a sudden reversal.
Long-term: Wait for confirmation of the
bottom reversal signal.
Colin Twiggs
Thought for the Day:
And therefore the cautious man, when it is time to act impetuously, does not know how to do so, and he is ruined;
but if he had changed his conduct with the times, Fortune would not have changed.
- Niccolo Machiavelli, The Prince (1532)
And therefore the cautious man, when it is time to act impetuously, does not know how to do so, and he is ruined;
but if he had changed his conduct with the times, Fortune would not have changed.
- Niccolo Machiavelli, The Prince (1532)
Back Issues
Click here to access the
Trading Diary Archives.
Back Issues
Access the Trading Diary Archives.