Suggestions
If you have any suggestions as to how we can improve the charts, website or newsletter,
please post them at the Chart Forum: Suggestion Box.
Trading Diary
October 15, 2002
These extracts from my daily trading diary are
intended to illustrate the techniques used in short-term trading
and should not be interpreted as investment advice. Full terms
and conditions can be found at Terms
of Use .
USA
The Dow had a
follow-through day on strong volume, rising 4.8% to 8255.
This completes a
bottom reversal as defined by William O'Neil. The Dow Theory
measure of primary trend direction will only turn up if we have a
rally above 9130 of at least 3 weeks duration.
The Nasdaq Composite Index gapped up to close at 1282, an increase of more than 5%. The follow-through day completes a bottom reversal as defined by William O'Neil. The primary trend will reverse if the rally lasts 3 or more weeks and breaks above 1426.
The S&P 500 gained 40 points to close at 881, breaking through resistance at 855. The follow-through day completes a bottom reversal as defined by William O'Neil. The index will complete a double bottom if it rises above 965. The primary trend is down.
The Chartcraft NYSE Bullish % Indicator reflects a bear confirmed signal at 26% (October 14).
Wall Street rally
Better than expected results from Johnson&Johnson, Citigroup and General Motors boosted the market at the opening. (J&J)(Citi)(GM)
Intel later disappointed with third-quarter earnings of 11 cents per share compared to expectations of 13 cents. (Intel)
Back Issues
Better than expected results from Johnson&Johnson, Citigroup and General Motors boosted the market at the opening. (J&J)(Citi)(GM)
Intel later disappointed with third-quarter earnings of 11 cents per share compared to expectations of 13 cents. (Intel)
Gold
New York: Spot gold last traded at $US 313.50, falling 390 cents to the lowest close in more than a month.
New York: Spot gold last traded at $US 313.50, falling 390 cents to the lowest close in more than a month.
ASX Australia
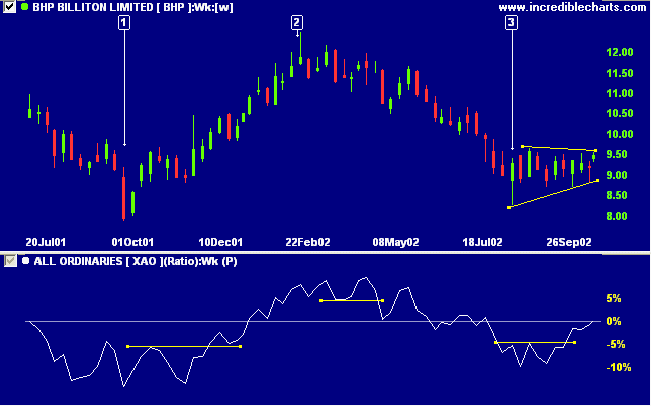
The All Ordinaries completed a
follow-through day on higher volume, breaking above
resistance at 2940. The index closed up 30 points at
2946.
A break above 3150 will signal a primary trend reversal.
MACD (26,12,9) has joined Slow Stochastic (20,3,3) above its signal line. Twiggs money flow signals accumulation following a bullish divergence.
A break above 3150 will signal a primary trend reversal.
MACD (26,12,9) has joined Slow Stochastic (20,3,3) above its signal line. Twiggs money flow signals accumulation following a bullish divergence.
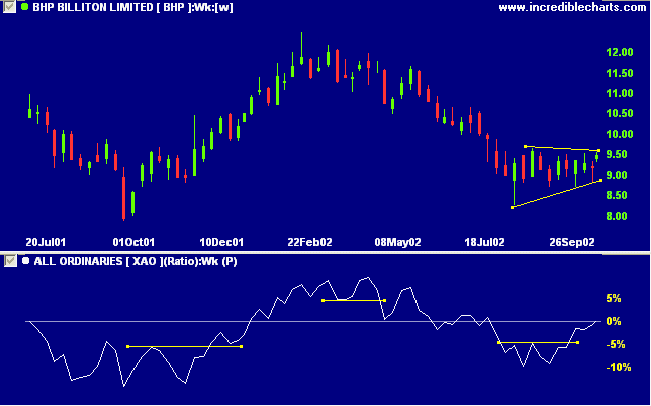
BHP Billiton [BHP]
Last covered on August 7.
BHP has formed two fairly equal lows about 12 months apart, after a stage 4 down-trend. A rise to 12.50 would complete a double bottom reversal. Relative strength (price ratio: xao) is rising and the stock appears to be forming a bullish ascending triangle.
Last covered on August 7.
BHP has formed two fairly equal lows about 12 months apart, after a stage 4 down-trend. A rise to 12.50 would complete a double bottom reversal. Relative strength (price ratio: xao) is rising and the stock appears to be forming a bullish ascending triangle.
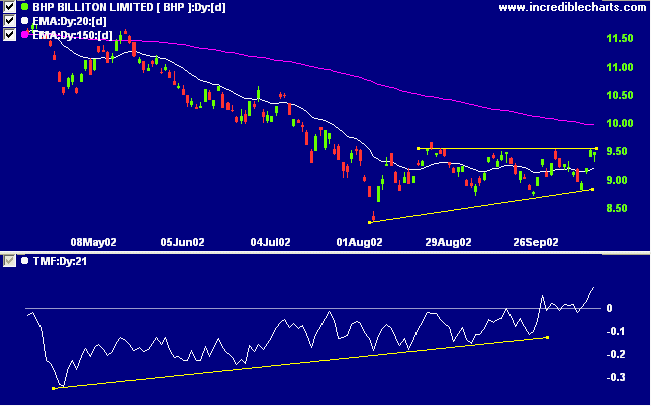
Twiggs money flow reflects a series of bullish divergences and
is now signaling accumulation, above zero.
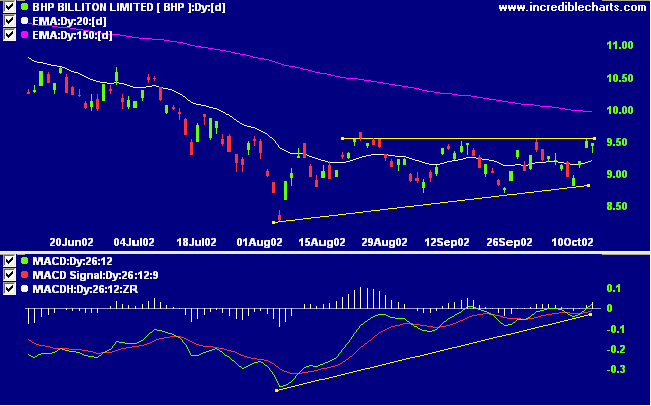
MACD also shows a bullish divergence. Resistance has formed at
9.55 to 9.66. Volume on the latest rallies is a bit thin.
A break above 9.55 will be a bear signal, confirmed if volume
rises and price penetrates above 9.66. A break below 8.71 will
be bearish.
Short-term: Long. The Slow Stochastic
and MACD are above their respective signal lines.
Medium-term: Long. I have seen
bottom reversals fail before, within 3 or 4 days of the
follow-through, but never one with this significant an
increase in volume, and across all three averages.
Long-term: Wait for confirmation of the
bottom reversal signal.
Colin Twiggs
Thought for the Day:
At times like this it is important to ignore all the speculation and conflicting opinions in the press
and to just concentrate on the message from the charts:
You do not need to know what the market is going to do!
All you need to know is what the market has actually done! This is the key!
- William J O'Neil, How to Make Money in Stocks
Back Issues
Click here to access the
Trading Diary Archives.
Back Issues
Access the Trading Diary Archives.