Suggestions
If you have any suggestions as to how we can improve the charts, website or newsletter,
please post them at the Chart Forum: Suggestion Box.
Trading Diary
October 14, 2002
These extracts from my daily trading diary are
intended to illustrate the techniques used in short-term trading
and should not be interpreted as investment advice. Full terms
and conditions can be found at Terms
of Use .
USA
The Dow closed up slightly at 7877 on low volume. Buying pressure
appears to be waning - the true test this week will be whether
the index can carry above the 8000 resistance level. The primary
trend is down.
The Nasdaq Composite Index gained 10 points to close at 1220. The primary trend is down.
The S&P 500 gained 6 points to close at 841. Immediate resistance is at 855 and the index will complete a double bottom if it rises above 965. The primary trend is down.
The Chartcraft NYSE Bullish % Indicator reflects a bear confirmed signal at 26% (October 11).
A quiet day on Wall Street
The absence of a sell-off, after two strong up days. Some see this as a good sign for the next few weeks. (more)

Back Issues
The absence of a sell-off, after two strong up days. Some see this as a good sign for the next few weeks. (more)
Gold
New York: Spot gold last traded at $US 317.40, up 130 cents.
New York: Spot gold last traded at $US 317.40, up 130 cents.
ASX Australia
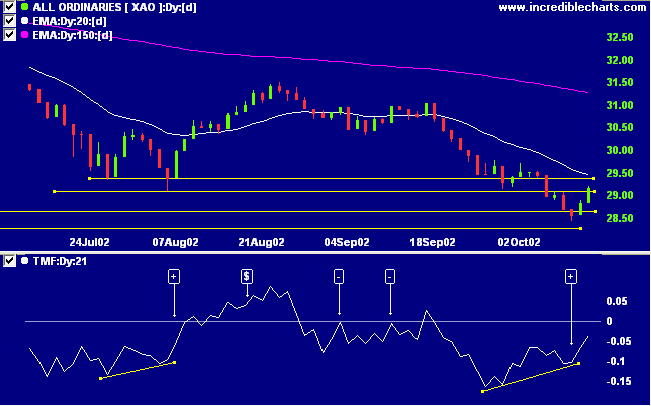
The All Ordinaries broke through initial resistance at 2909,
closing up 33 points on light volume. The primary trend is
still down.
Slow Stochastic (20,3,3) is above its signal line; MACD (26,12,9) is below. Twiggs money flow signals a bullish divergence [+].
Slow Stochastic (20,3,3) is above its signal line; MACD (26,12,9) is below. Twiggs money flow signals a bullish divergence [+].
Sons of Gwalia [SGW]
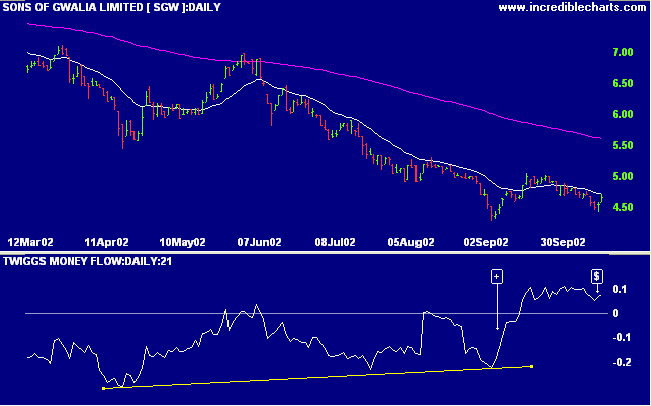
A lot has happened since September 2 when SGW was last covered.
The stock has formed a bullish falling wedge while in a stage 4 down-trend. Relative strength (price ratio: xao) has been falling for the last 16 months but may be showing early signs of a reversal, forming a higher low.
A lot has happened since September 2 when SGW was last covered.
The stock has formed a bullish falling wedge while in a stage 4 down-trend. Relative strength (price ratio: xao) has been falling for the last 16 months but may be showing early signs of a reversal, forming a higher low.
MACD shows a bullish divergence. Twiggs money flow shows a
bullish divergence [+] followed by strong accumulation [$] with
TMF holding above zero.
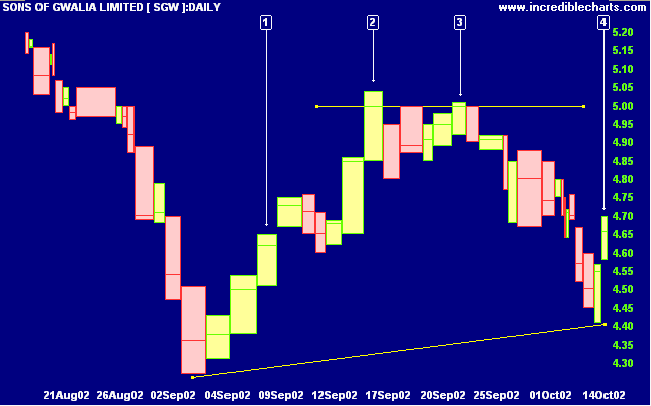
On the equivolume chart SGW appears to be forming an
ascending triangle with resistance at 5.00 after equal
highs at [2] and [3]. Volume on the latest rally [4] is a bit
thin and some heavier volume, as in the previous rally [1],
would be reassuring.
A break above 5.00 on strong volume will be a bull signal,
while a break below 4.35 will be a bearish continuation signal.
Short-term: Avoid new entries. The Slow Stochastic and MACD are
on opposite sides of their respective signal lines.
Medium-term: Wait for the All Ords to signal a reversal.
Long-term: Wait for a bull-trend on the Nasdaq or S&P 500
(primary cycle).
Colin Twiggs
Thought for the Day:
Ordinary mortals know what's happening now,
the gods know what the future holds
because they are totally enlightened.
Wise men are aware of future things
just about to happen.
- C.P. Cavafy, a poem based on lines by Philostratos
Ordinary mortals know what's happening now,
the gods know what the future holds
because they are totally enlightened.
Wise men are aware of future things
just about to happen.
- C.P. Cavafy, a poem based on lines by Philostratos
Back Issues
Click here to access the
Trading Diary Archives.
Back Issues
Access the Trading Diary Archives.