Suggestions
If you have any suggestions as to how we can improve the charts, website or newsletter,
please post them at the Chart Forum: Suggestion Box.
Trading Diary
October 11, 2002
These extracts from my daily trading diary are
intended to illustrate the techniques used in short-term trading
and should not be interpreted as investment advice. Full terms
and conditions can be found at Terms
of Use .
USA
Following yesterday's key
reversal, the Dow broke through resistance at 7600 and
rocketed up 4.4%, closing at 7850 on strong volume. The first 2
days of a correction are unreliable and the true test will be
whether the index can carry above the 8000 resistance level in
the next week.
The primary trend is down.
The Nasdaq Composite Index gapped up at the open, closing 4.0% up at 1210. The primary trend is down.
The S&P 500 rose 32 points to close at 835. Resistance is at 855. A key level is 965 - the index will complete a double bottom if it rises above this level.
The primary trend is down.
The Chartcraft NYSE Bullish % Indicator reflects a bear confirmed signal at 26% (October 10).
The primary trend is down.
The Nasdaq Composite Index gapped up at the open, closing 4.0% up at 1210. The primary trend is down.
The S&P 500 rose 32 points to close at 835. Resistance is at 855. A key level is 965 - the index will complete a double bottom if it rises above this level.
The primary trend is down.
The Chartcraft NYSE Bullish % Indicator reflects a bear confirmed signal at 26% (October 10).
General Electric and IBM rally the market
GE reported an 11% increase in third-quarter sales while profits increased 25%, boosted by the sale of their e-commerce unit. IBM climbed 11% after Lehman Brothers analyst Dan Niles upgraded his rating, predicting that IBM sales will recover next year. (GE)(IBM)
GE reported an 11% increase in third-quarter sales while profits increased 25%, boosted by the sale of their e-commerce unit. IBM climbed 11% after Lehman Brothers analyst Dan Niles upgraded his rating, predicting that IBM sales will recover next year. (GE)(IBM)
Bonds fall as stocks rally
The yield on 10-year treasury notes spiked up to 3.8%, off a low of 3.56%. (more)
Back Issues
The yield on 10-year treasury notes spiked up to 3.8%, off a low of 3.56%. (more)
Gold
New York: The spot gold price closed down 30 cents at $US 316.10.
New York: The spot gold price closed down 30 cents at $US 316.10.
ASX Australia
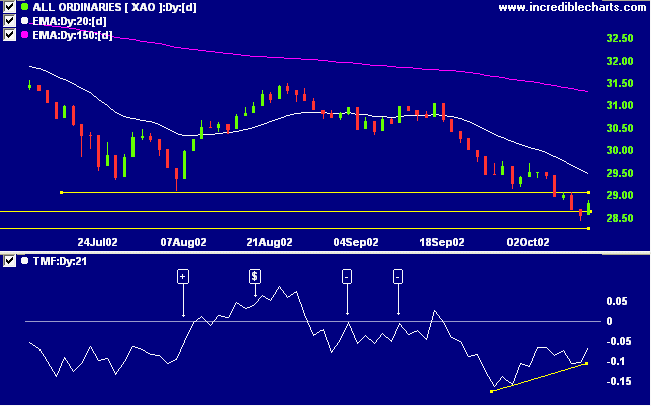
The All Ordinaries rallied to 2883, up 28 points on average
volume. Overhead resistance is at 2909. The primary trend is
down.
Slow Stochastic (20,3,3) has crossed to above its signal line; MACD (26,12,9) is below. Twiggs money signals a bullish divergence.
Slow Stochastic (20,3,3) has crossed to above its signal line; MACD (26,12,9) is below. Twiggs money signals a bullish divergence.
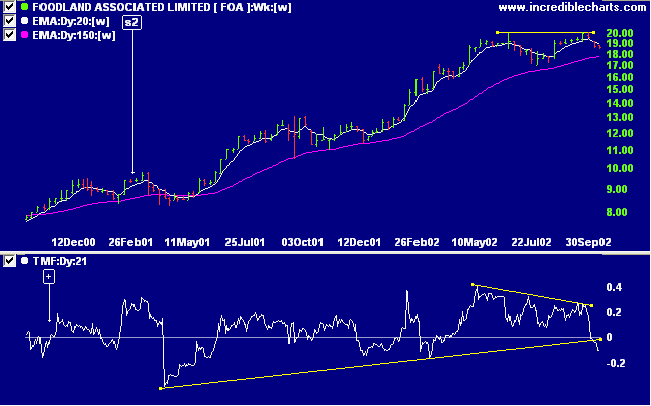
Foodland [FOA]
Last covered on September 16.
Foodland has formed two equal highs at 20.00 while in a stage 2 up-trend. Relative strength (price ratio: xao) and the 150-day moving average are still rising but Twiggs money flow shows a bearish divergence and has broken below its 18-month trendline.
Last covered on September 16.
Foodland has formed two equal highs at 20.00 while in a stage 2 up-trend. Relative strength (price ratio: xao) and the 150-day moving average are still rising but Twiggs money flow shows a bearish divergence and has broken below its 18-month trendline.
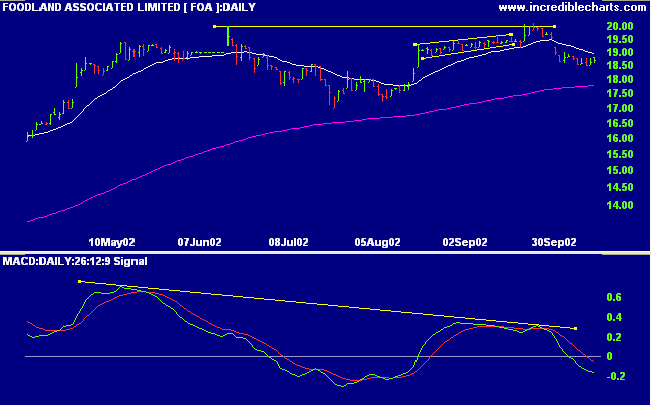
MACD shows a bearish divergence as well.
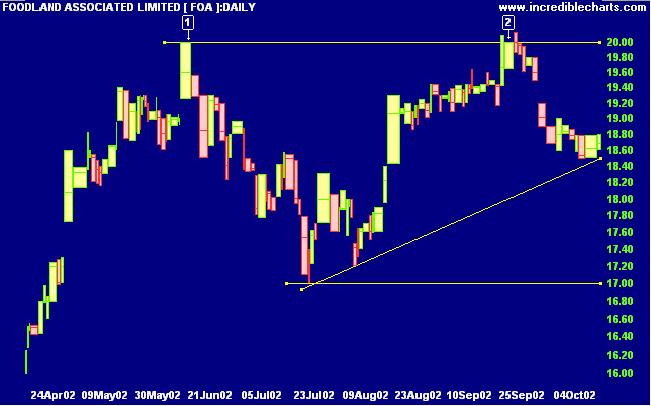
Equal highs (see [1] and [2] on the equivolume chart) are
treacherous to trade because the pattern can evolve into
either an
ascending triangle continuation pattern or a double
top reversal.
A break above 20.00 will be a strong bull signal, while a
break below 17.00 will be an equally strong bear signal. The
targeted move for either breakout is 3.00 (20.00 - 17.00).
This gives an objective of 23.00 (20.00 + 3.00) for the bull
signal and 14.00 (17.00 - 3.00) for the bear reversal.
Sector Analysis
Changes are highlighted in bold.
Changes are highlighted in bold.
- Energy [XEJ] - stage 4 (RS is rising)
- Materials [XMJ] - stage 4
- Industrials [XNJ] - stage 4 (RS is falling)
- Consumer Discretionary [XDJ] - stage 4 (RS is falling)
- Consumer Staples [XSJ] - stage 1 (RS is rising)
- Health Care [XHJ] - stage 4 (RS is falling)
- Property Trusts [XPJ] - stage 2 (RS is rising)
- Financial excl. Property Trusts [XXJ] - stage 4 (RS is falling)
- Information Technology [XIJ] - stage 4 (RS is falling)
- Telecom Services [XTJ] - stage 1 (RS is rising)
- Utilities [XUJ] - stage 2 (RS is rising)
Sectors: Relative Strength
A stock screen of the ASX 200 using % Price Move (1 month: +5%) returns 11 stocks (compared to 99, August 23rd and 10 on October 4th).
A stock screen of the ASX 200 using % Price Move (1 month: +5%) returns 11 stocks (compared to 99, August 23rd and 10 on October 4th).
Short-term: Avoid new entries. The Slow Stochastic and MACD
are on opposite sides of their respective signal lines.
Medium-term: Wait for the All Ords to signal a reversal.
Long-term: Wait for a bull-trend on the Nasdaq or S&P 500
(primary cycle).
Colin Twiggs
Thought for the Day:
One of the most helpful things that anybody can learn is to give up trying to catch the last eighth - or the first.
These two are the most expensive eighths in the world.
- Edwin Lefevre, Reminiscences of a Stock Operator (1923)
One of the most helpful things that anybody can learn is to give up trying to catch the last eighth - or the first.
These two are the most expensive eighths in the world.
- Edwin Lefevre, Reminiscences of a Stock Operator (1923)
Back Issues
Click here to access the
Trading Diary Archives.
Back Issues
Access the Trading Diary Archives.