Incredible Charts version 4.0.0.6
Use Help >>About to check that you have the latest update. The new version offers:
-
A Price
Ratio (relative strength) indicator that applies to all
securities in a project.
When installing on the Indicator Panel, select "Apply to Project".
-
New Stock Screens
- Directional Movement (+DI, -DI and ADX)
- MACD above or below zero
- Volume Filter
- Equivolume with closing prices
Trading Diary
October 07, 2002
These extracts from my daily trading diary are
intended to illustrate the techniques used in short-term trading
and should not be interpreted as investment advice. Full terms
and conditions can be found at Terms
of Use .
USA
The Dow lost a further 1.4% to close at 7423 on lower
volume.
The primary trend is down.
The Nasdaq Composite Index shed 1.8% to close at 1119.
The primary trend is down.
The S&P 500 has broken below support at 800 and is testing July lows, closing 15 points down at 785.
The primary trend is down.
The Chartcraft NYSE Bullish % Indicator reflects a bear confirmed signal at 30% (October 4).
The primary trend is down.
The Nasdaq Composite Index shed 1.8% to close at 1119.
The primary trend is down.
The S&P 500 has broken below support at 800 and is testing July lows, closing 15 points down at 785.
The primary trend is down.
The Chartcraft NYSE Bullish % Indicator reflects a bear confirmed signal at 30% (October 4).
JP Morgan cuts staff
The decision by JP Morgan to cut 4000 (20%) of its workforce may be the forerunner of staff cuts in an overweight US brokerage industry. (more)
Back Issues
The decision by JP Morgan to cut 4000 (20%) of its workforce may be the forerunner of staff cuts in an overweight US brokerage industry. (more)
Gold
New York: The spot gold price is unchanged at $US 322.10.
New York: The spot gold price is unchanged at $US 322.10.
ASX Australia
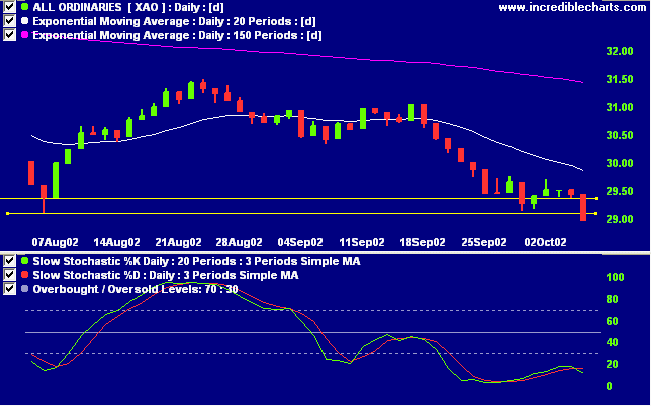
The All Ordinaries index has broken through support at 2940 to
2909, closing at 2896 on low volume. The next band of support
is at 2867 to 2828, from September 2001. The primary trend is
down.
Slow Stochastic (20,3,3) has crossed to below its signal line, to join MACD (26,12,9). Twiggs money flow signals distribution.
Slow Stochastic (20,3,3) has crossed to below its signal line, to join MACD (26,12,9). Twiggs money flow signals distribution.
QBE Insurance [QBE]
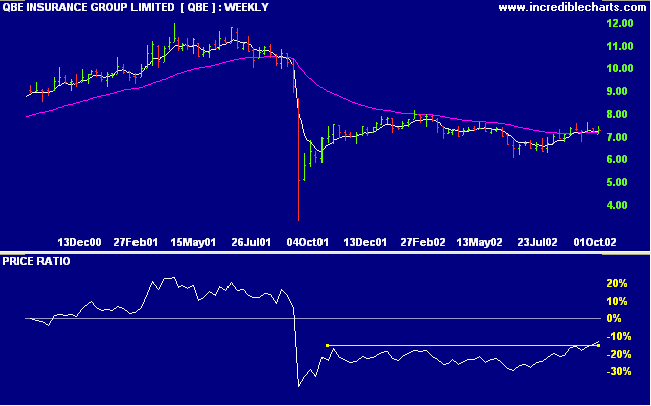
After a disastrous fall in September 2001, QBE has entered a stage 1 base, with relative strength (price ratio: xao) rising. The 150-day exponential moving average has leveled after a long decline.
After a disastrous fall in September 2001, QBE has entered a stage 1 base, with relative strength (price ratio: xao) rising. The 150-day exponential moving average has leveled after a long decline.
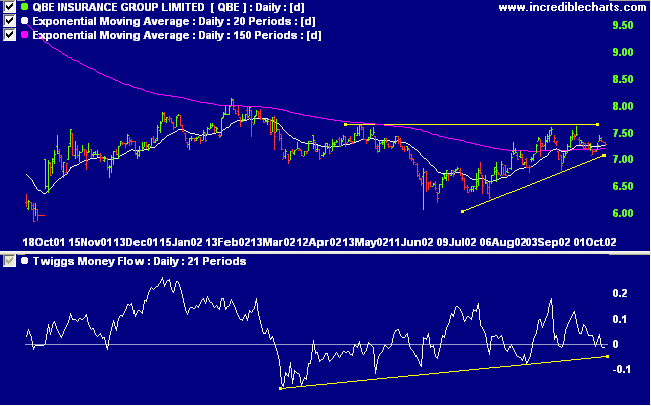
The daily chart shows a bullish ascending triangle pattern and
a bullish divergence on Twiggs money flow.
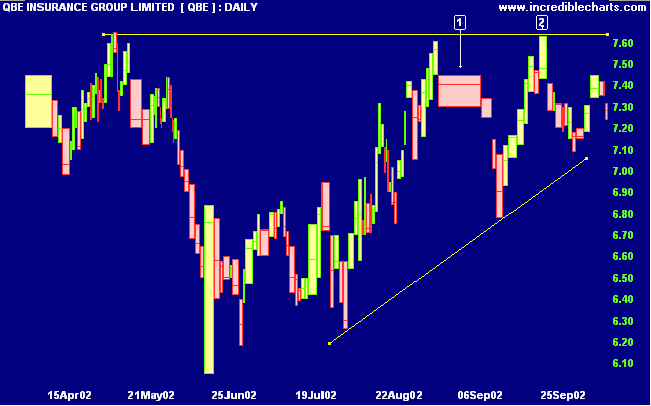
Last covered on
September 10, after a strong selloff [1], QBE rallied to
re-test resistance at 7.64 [2]. The test was weak, as can be
seen from the low close, and it may take several more tests
before a rally breaks above the resistance level.
The shaded areas on the equivolume chart depict closing prices: the lighter shade is above the close in an up-trend, and below the close in a down-trend.
The shaded areas on the equivolume chart depict closing prices: the lighter shade is above the close in an up-trend, and below the close in a down-trend.
Short-term: Short. The Slow Stochastic and MACD are below their
respective signal lines.
Medium-term: Wait for the All Ords to signal a reversal.
Long-term: Wait for a bull-trend on the Nasdaq or S&P 500
(primary cycle).
Colin Twiggs
Thought for the Day:
To be a successful trader, you have to be able to admit mistakes .... the person who can easily admit to being wrong is the one who walks away a winner.
Victor Sperandeo - The New Market Wizards by Jack Schwager
To be a successful trader, you have to be able to admit mistakes .... the person who can easily admit to being wrong is the one who walks away a winner.
Victor Sperandeo - The New Market Wizards by Jack Schwager
Back Issues
Click here to access the
Trading Diary Archives.
Back Issues
Access the Trading Diary Archives.