Incredible Charts version 4.0.0.5
To be released this weekend, the new version offers:
-
A Price Ratio (relative strength) indicator
that can apply to all securities in a project.
When installing on the Indicator Panel, select "Apply to Project".
-
New Stock Screens
- Directional Movement (+DI, -DI and ADX)
- MACD above or below zero
- Volume Filter
- Equivolume with closing prices
Trading Diary
October 04, 2002
These extracts from my daily trading diary are
intended to illustrate the techniques used in short-term trading
and should not be interpreted as investment advice. Full terms
and conditions can be found at Terms
of Use .
USA
The Dow closed at its lowest level since 1997, down 2.4% at 7528
on strong volume.
The primary trend is down.
The Nasdaq Composite Index, already well below 1998 lows, lost 2.2% to close at 1139.
The primary trend is down.
The S&P 500 closed 18 points down, at the 800 support level.
The primary trend is down.
The Chartcraft NYSE Bullish % Indicator reflects a bear confirmed signal at 32% (October 3).
The primary trend is down.
The Nasdaq Composite Index, already well below 1998 lows, lost 2.2% to close at 1139.
The primary trend is down.
The S&P 500 closed 18 points down, at the 800 support level.
The primary trend is down.
The Chartcraft NYSE Bullish % Indicator reflects a bear confirmed signal at 32% (October 3).
Earnings warnings trigger fall
A spate of earnings warnings, from drug maker Schering-Plough, Boeing and data storage specialist EMC, hammered market confidence.
A spate of earnings warnings, from drug maker Schering-Plough, Boeing and data storage specialist EMC, hammered market confidence.
Philip Morris slugged
A California court orders cigarette maker Philip Morris to pay $US 28 billion dollars in punitive damages, to a 64-year old woman with lung cancer. The size of the award may be reduced on appeal but will encourage further litigants.
Back Issues
A California court orders cigarette maker Philip Morris to pay $US 28 billion dollars in punitive damages, to a 64-year old woman with lung cancer. The size of the award may be reduced on appeal but will encourage further litigants.
Gold
New York: The spot gold price closed up 110 cents at $US 322.10.
New York: The spot gold price closed up 110 cents at $US 322.10.
ASX Australia
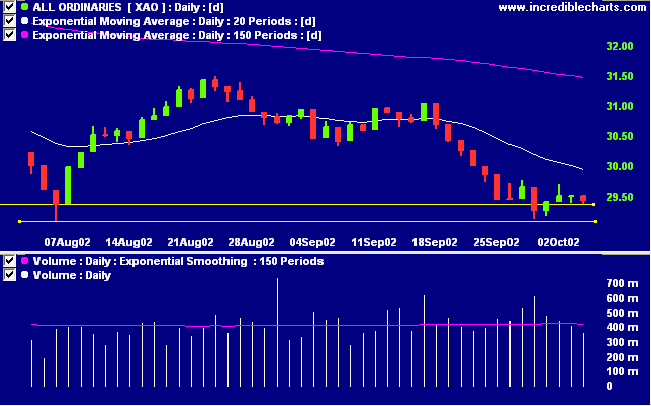
The All Ordinaries index declined 8 points to 2944 on lower
volume. After reaching support levels, the index has failed
to "bounce" (as it did in August) and is hovering just above
2940. Prepare for a test of support, possibly with a break
down to the next major support level at 2870, from September
2001.
Slow Stochastic (20,3,3) is above its signal line, while MACD (26,12,9) is below. Twiggs money is still below zero.
The primary trend is down.
Slow Stochastic (20,3,3) is above its signal line, while MACD (26,12,9) is below. Twiggs money is still below zero.
The primary trend is down.
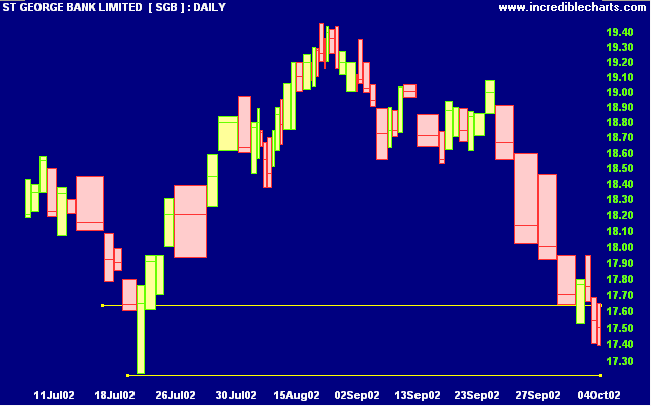
St George Bank [SGB]
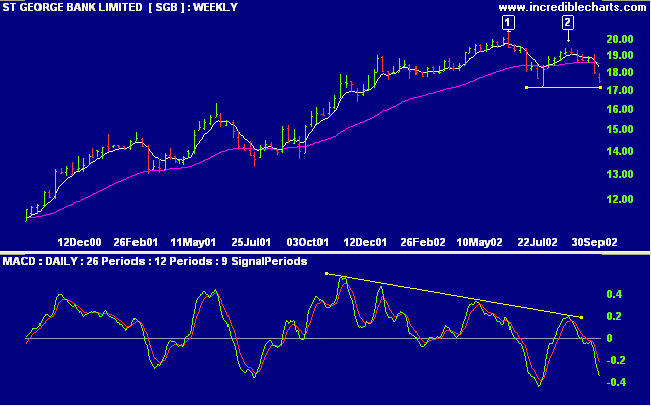
SGB has entered a stage 3 top, after a strong up-trend. The last peak at [2] is lower than the June 2002 high [1] of 20.47 and price appears set to test support at the intervening trough. A break below this level will signal a primary trend reversal (ie. commencement of a down-trend).
MACD displays a strong bearish divergence.
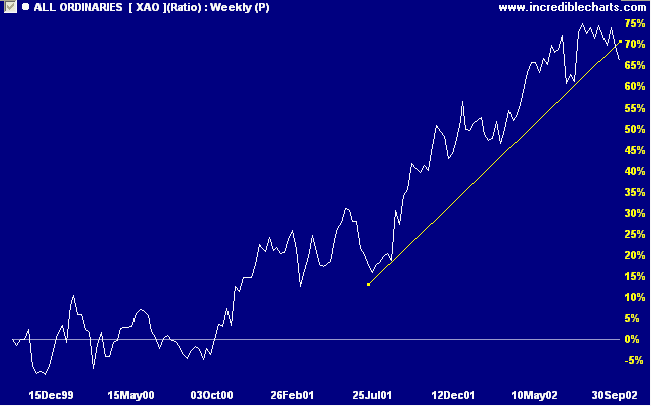
Relative strength (price ratio: xao) has broken below its
long-term trendline.
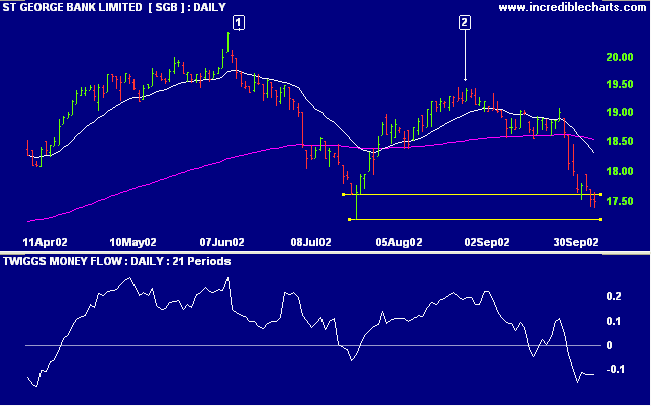
Twiggs money flow, after a long period of accumulation, now
signals distribution.
SGB has already broken below the upper limit of support at
17.64 and appears set to test the lower limit at 17.22. A
fall below this level will be a strong bear signal.
The shaded areas on the equivolume chart depict closing prices: the lighter shade is above the close in an up-trend, and below the close in a down-trend.
The shaded areas on the equivolume chart depict closing prices: the lighter shade is above the close in an up-trend, and below the close in a down-trend.
Sector Analysis
Changes are highlighted in bold.
Changes are highlighted in bold.
- Energy [XEJ] - stage 1
- Materials [XMJ] - stage 4
- Industrials [XNJ] - stage 4 (RS is falling)
- Consumer Discretionary [XDJ] - stage 4 (RS is falling)
- Consumer Staples [XSJ] - stage 1 (RS is rising)
- Health Care [XHJ] - stage 4 (RS is falling)
- Property Trusts [XPJ] - stage 3 (RS is rising)
- Financial excl. Property Trusts [XXJ] - stage 4
- Information Technology [XIJ] - stage 4 (RS is falling)
- Telecom Services [XTJ] - stage 1
- Utilities [XUJ] - stage 2 (RS is rising)
Sectors: Relative Strength
A stock screen of the ASX 200 using % Price Move (1 month: +5%) is now down to 10 stocks, compared to 99 on August 23.
Notable sectors:
A stock screen of the ASX 200 using % Price Move (1 month: +5%) is now down to 10 stocks, compared to 99 on August 23.
Notable sectors:
- Food Retail
Short-term: Avoid new entries. The Slow Stochastic and MACD
are on opposite sides of their respective signal lines.
Medium-term: Wait for the All Ords to signal a reversal.
Long-term: Wait for a bull-trend on the Nasdaq or S&P 500
(primary cycle).
Colin Twiggs
Thought for the Day:
The market is not like a balloon plunging hither and thither in the wind. As a whole, it represents a serious, well considered effort on the part of far-sighted and well-informed men to adjust prices to such values as exist or which are expected to exist in the not too remote future.
- SA Nelson
(Possibly analysts in 1903 were more far-sighted than they are today)
Back Issues
Click here to access the
Trading Diary Archives.
Back Issues
Access the Trading Diary Archives.