Trading Diary
August 2, 2002
These extracts from my daily trading diary are
intended to illustrate the techniques used in short-term trading
and should not be interpreted as investment advice. Full terms
and conditions can be found at Terms
of Use .
USA
The Dow has failed to hold above Monday's
follow-through, falling 2.3% to close at 8313. The primary
cycle trends downwards.
The Chartcraft NYSE Bullish % Indicator has given a bull alert signal, starting a new column with a reading of 30% (August 1).
The Nasdaq Composite, down 2.5% at 1247, closed the breakaway gap from Monday's follow-through. The primary cycle is in a down-trend.
The S&P 500 closed 20 points down at 864, holding just
above the
follow-through day from Monday.
The primary cycle trends downwards.
Weak job growth scares the market
Net jobs created in July were only 6000, compared to 66000 in
June. (more)
Further rate cuts
Goldman Sachs predicts that the Fed will cut rates further before
the end of the year.
US bond yields fall
Money flowing out of equities and talk of further rate cuts drive
bond yields to new lows. (more)
ASX Australia
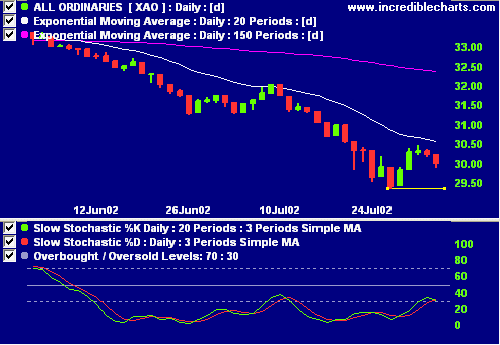
The All Ordinaries closed down 21 points at 3003 on low volume.
The index is still above the 2940 support level. The primary
cycle trends down.
Slow Stochastic (20,3,3) crossed below its signal line.
Exponentially-smoothed money flow signals distribution.
Spot the typo (from yesterday's newsletter)
LHG is entering a stage 4 decline, with 20-day moving average
crossing below the 150-day moving average. Relative strength
(price ratio: xao) is declining and MACD is weak but
exponentially-smoothed money flow displays a bearish
divergence.
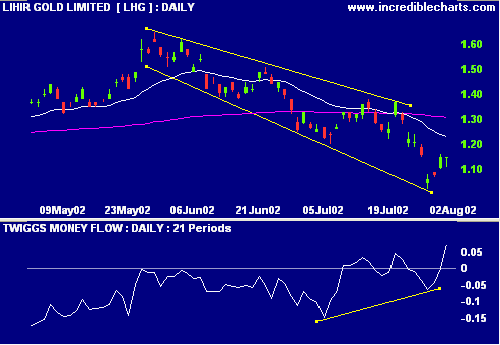
Exponentially-smoothed money flow displays a bullish divergence.
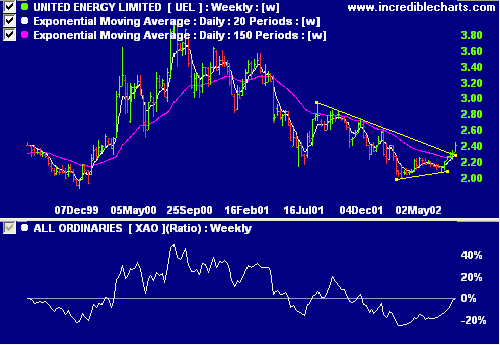
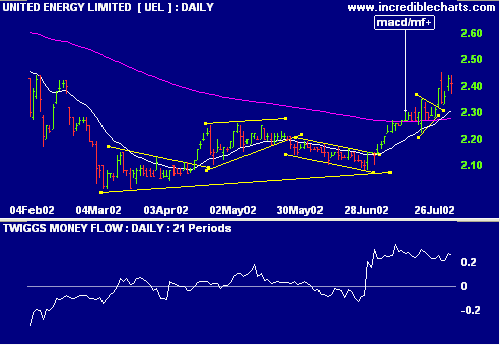
United Energy [UEL]
UEL recently broke up from a large triangle. Relative strength
(price ratio: xao) is improving, MACD is positive and
exponentially-smoothed money flow signals accumulation.
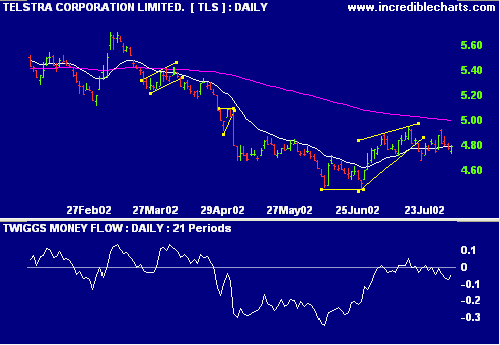
Telstra [TLS]
TLS relative strength (price ratio: xao) has lately been
improving and MACD is strong but exponentially-smoothed money
flow has failed to hold in positive territory.
Sector Analysis
Stage changes are highlighted in bold.
Stage changes are highlighted in bold.
- Energy [XEJ] - stage 4 (RS is rising)
- Materials [XMJ] - stage 4
- Industrials [XNJ] - stage 4 (RS is rising)
- Consumer Discretionary [XDJ] - stage 4
- Consumer Staples [XSJ] - stage 4 (RS is rising)
- Health Care [XHJ] - stage 4
- Property Trusts [XPJ] - stage 4 (RS is rising)
- Financial excl. Property Trusts [XXJ] - stage 4
- Information Technology [XIJ] - stage 4
- Telecom Services [XTJ] - stage 1 (RS is rising)
- Utilities [XUJ] - stage 1 (RS is rising)
Sectors: Relative Strength
A stock screen of the ASX 200 using % Price Move (1 month: +5%) shows the strongest sectors as:
A stock screen of the ASX 200 using % Price Move (1 month: +5%) shows the strongest sectors as:
- Electric Utilities
- Construction & Engineering
- Oil & Gas Exploration & Production
Conclusion
Short-term: Avoid new entries. Slow Stochastic and MACD are on
opposite sides of their respective signal lines.
Medium-term: Wait for the All Ords to signal a reversal.
Long-term: Wait for a bull-trend on the Nasdaq or S&P 500
(primary cycle).
Colin Twiggs
Thought for the Day:
The stock market is neither efficient nor random. It is not efficient because there are too many poorly conceived opinions; it is not random because strong investor emotions can create trends.
- William J O'Neil.
The stock market is neither efficient nor random. It is not efficient because there are too many poorly conceived opinions; it is not random because strong investor emotions can create trends.
- William J O'Neil.
Back Issues
Click here to access the
Trading Diary Archives.
Back Issues
Access the Trading Diary Archives.