Trading Diary
June 21, 2002
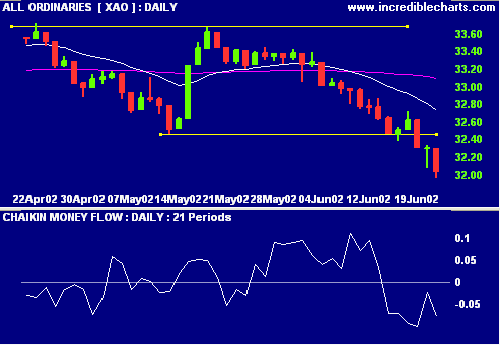
Primary and secondary cycles trend downwards, in a bear market.
The Nasdaq Composite dropped 1.6% to 1440,
close to the 1400/1425 support level from September last
year.
The primary and secondary cycles are in a down-trend.
The S&P 500 lost a further 17 points to
close at 989 - approaching the 960 target from the double-top
pattern completed
May 6th.
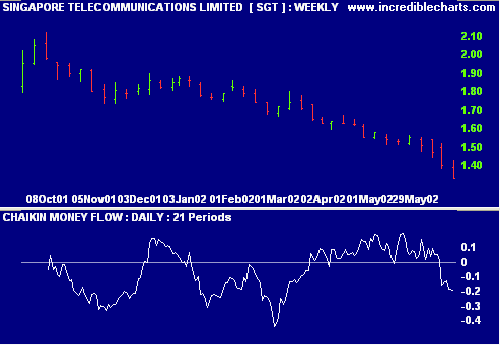
Primary and secondary cycles trend downwards.
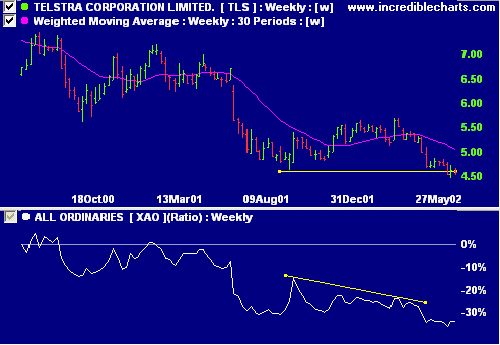
SingTel [SGT] charts paint a similar picture.
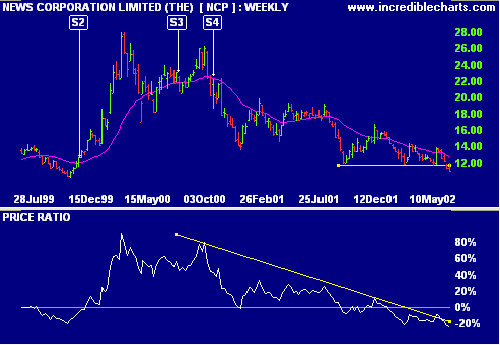
NewsCorp [NCP]
NCP
continues its stage 4 decline, having broken below
support at $11.80. Chaikin MF, MACD and Relative Strength
all show weakness.
Sector Analysis
I have
grouped the old ASX sectors under their new GICS
headings. This not 100% accurate - some stocks have been
re-classified. The [%] after the heading is a rough guide
to the size of the sector as a percentage of the total
market.
Energy [3%] - stage 1
Energy (XEY) - stage 4
Materials [15%] - stage 3
Gold (XGO), Paper & Packaging (XPP),
Chemicals (XCE) - stage 2
Building Materials (XBM), Other Metals (XOM) - stage
3
Diversified Resources (XDR) - stage 4
Industrials [7%] - stage 4
Engineering (XEG) and Transport (XTP) -
stage 3
Diversified Industrials (XDI) - stage 4
Consumer Discretionary [17%] - stage 4
Tourism & Leisure (XTU) -stage
2
Media (XME) - stage 4
Consumer Staples [7%] - stage 3
Food & Household Goods (XFH) - stage
2
Retail (XRE) - stage 3
Alcohol & Tobacco (XAT) - stage 4
Health Care [3%] - stage 4
Health & Biotech (XBH) - stage 4
Property Trusts [5%] - stage 2
Property Trusts (XPT) - stage 2
Financial excl. Property Trusts [31%] - stage 2
Banks & Finance (XBF) - stage
2
Investment & Financial Services (XIF), Developers
(XDC) and Insurance (XIN) - stage 4
Information Technology [1%] - stage 4
Miscellaneous Industrials (Technology) (XMI) - stage 1
Telecom Services [10%] - stage 4
Telecom (XTE) - stage 4
Utilities [1%] - stage 1
Infrastructure Utilities (XIU) - stage 4
Note the differences between the stage
analysis of Energy and Utilities under the old and new
systems - due to re-classification.
At the end of June the ASX will cease to provide the old
ASX indices. We are endeavoring to find other
sources.
Sectors: Stock Screens
A
stock screen of equities using % Price Move (1 month:
+10%, 1 year: +30%) is dominated by Gold Producers, Gold
Explorers, Mineral Sands, Mining Explorers, and Oil
& Gas stocks.
A stock screen of equities using % of High (1 year: 100% minimum) reveals a number of Gold stocks, Equity Investors and Property stocks making new highs.
Colin Twiggs
Back Issues